Copyright
©2013 Baishideng Publishing Group Co.
World J Gastroenterol. Jun 7, 2013; 19(21): 3217-3225
Published online Jun 7, 2013. doi: 10.3748/wjg.v19.i21.3217
Published online Jun 7, 2013. doi: 10.3748/wjg.v19.i21.3217
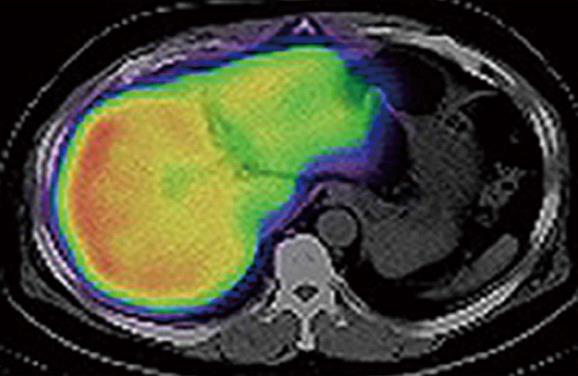
Figure 1 Computed tomography/99mTc-galactosyl human serum albumin single-photon emission computed tomography fusion image in a 58-year-old male with early gallbladder cancer.
The uptake of 99mTc-galactosyl human serum albumin was markedly decreased in the interior portion of the left lobe. This computed tomography image was at the level of the center of the left lobe, and was neither the cranial edge nor the caudal edge of that lobe.
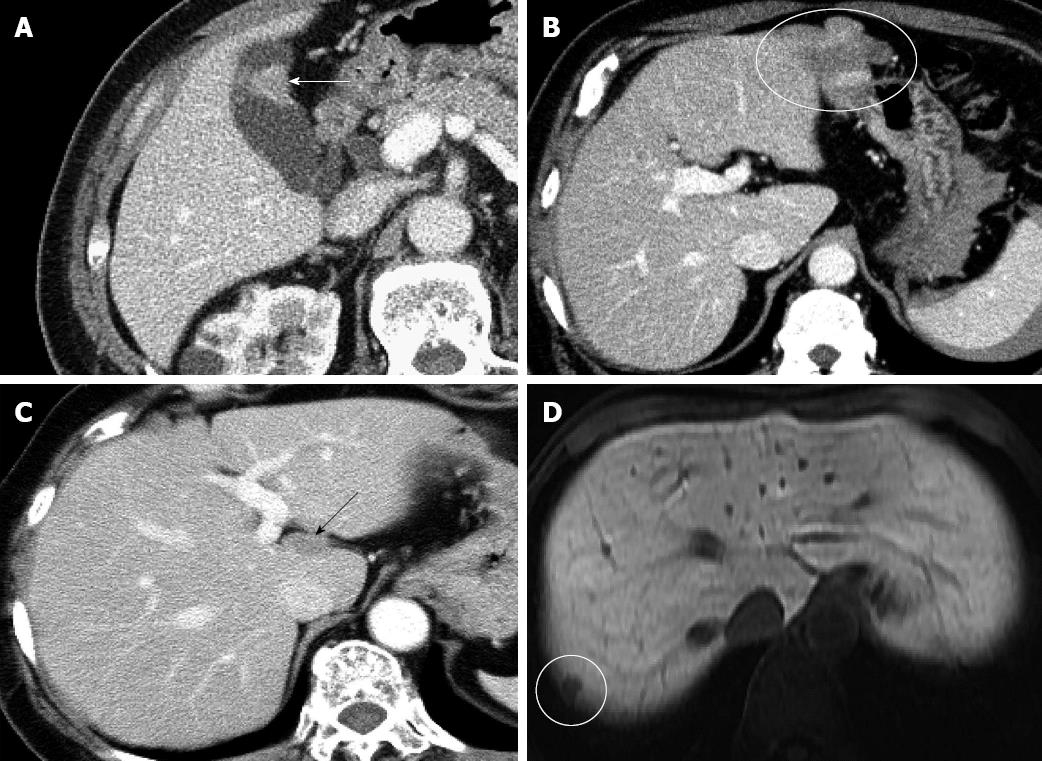
Figure 2 Computed tomography images of patients meeting criterion 1 or 2.
A: An 82-year-old man with early gallbladder cancer, in whom the preoperative computed tomography (CT) scan showed a tumor localized in the gallbladder (white arrow); B: A 59-year-old man with gastric gastrointestinal stromal tumor, in whom a preoperative CT scan showed that the tumor had invaded the left lateral segment of the liver. However, no invasion into the liver was detected intraoperatively (circle); C: A 64-year-old woman with peritoneal dissemination of ovarian cancer, in whom a preoperative CT scan showed an implanted small tumor on the surface of the left caudate lobe (black arrow); D: A 62-year-old woman with liver metastasis, in whom a preoperative magnetic resonance image showed a small (5 mm) tumor on the liver surface (circle).
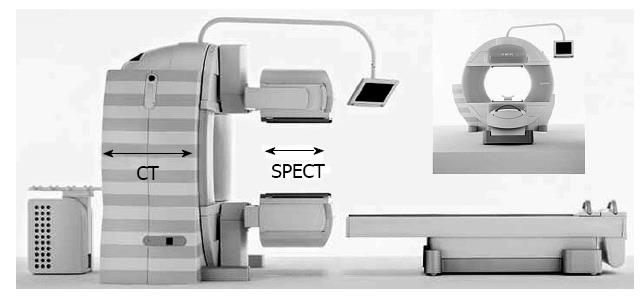
Figure 3 Integrated computed tomography and single-photon emission computed tomography system, consisting of variable angle dual-detector single-photon emission computed tomography and 6-slice computed tomography.
The system allows the seamless transition from a single-photon emission computed tomography (SPECT) examination to a computed tomography (CT) examination.
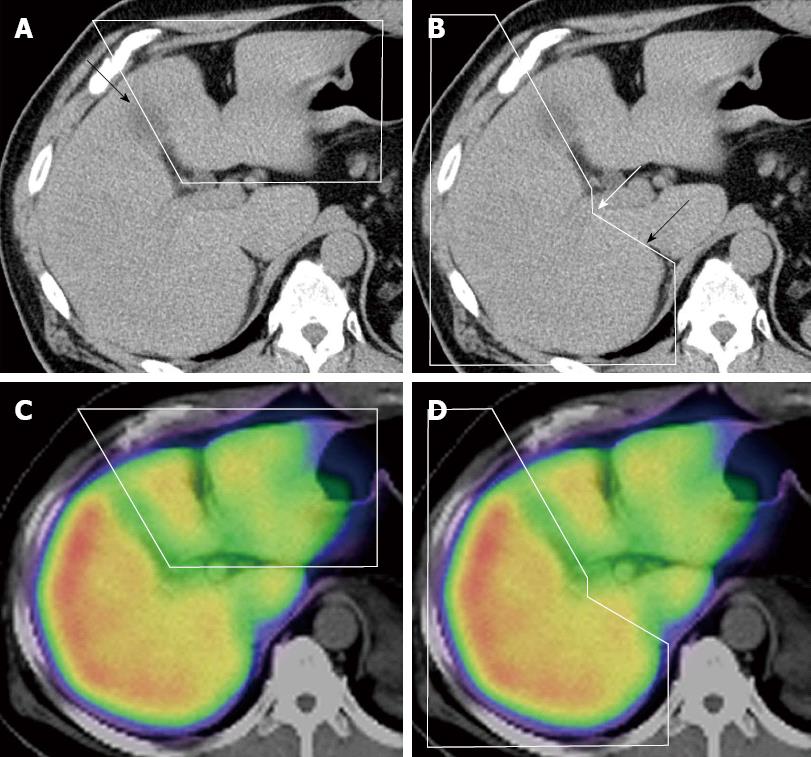
Figure 4 Range of each lobe on the computed tomography and computed tomography/single-photon emission computed tomography fusion image.
A: The extent of the left lobe is manually circled on the non-enhanced computed tomography (CT) image. The arrow shows the gallbladder bed; B: The extent of the right lobe on the non-enhanced CT image. The boundary between the right lobe and the caudate lobe was defined by the line connecting the bifurcation of the right portal vein (white arrow) and the right wall of the inferior vena cava (black arrow); C and D: The extent of each lobe determined from the CT image was automatically projected on the single-photon emission computed tomography/CT fusion image (C: Left lobe; D: Right lobe).
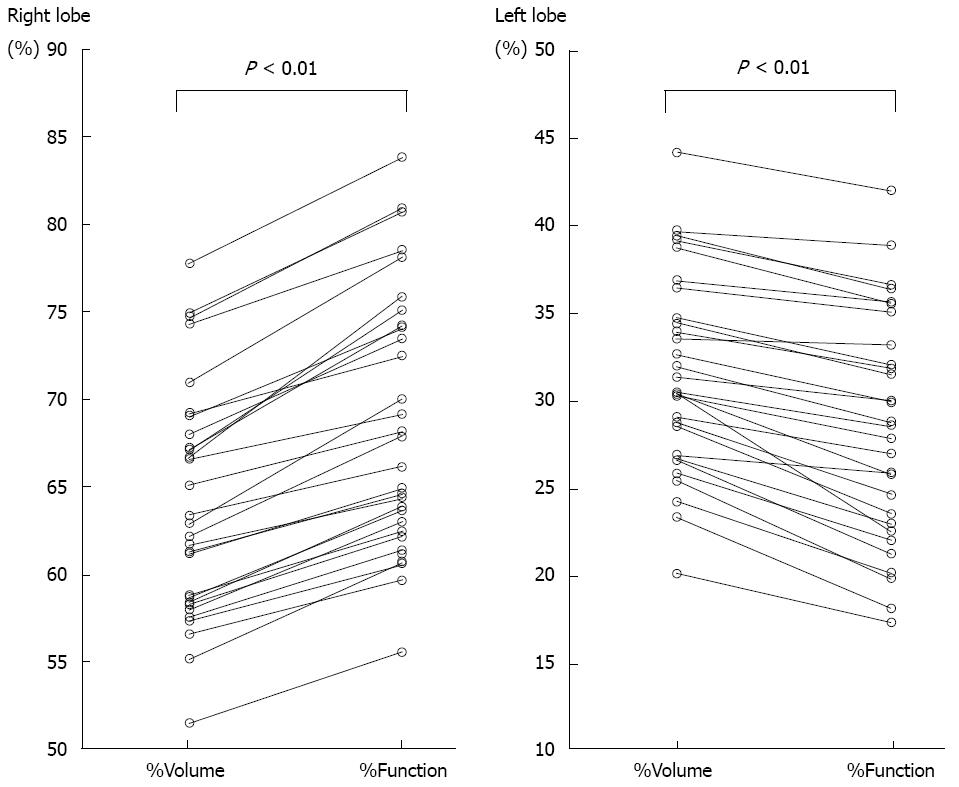
Figure 5 Percentage volume and percentage function of each lobe.
The %Function was significantly higher than the %Volume in the right lobe (P < 0.01). The %Function was significantly lower than the %Volume in the left lobe (P < 0.01).
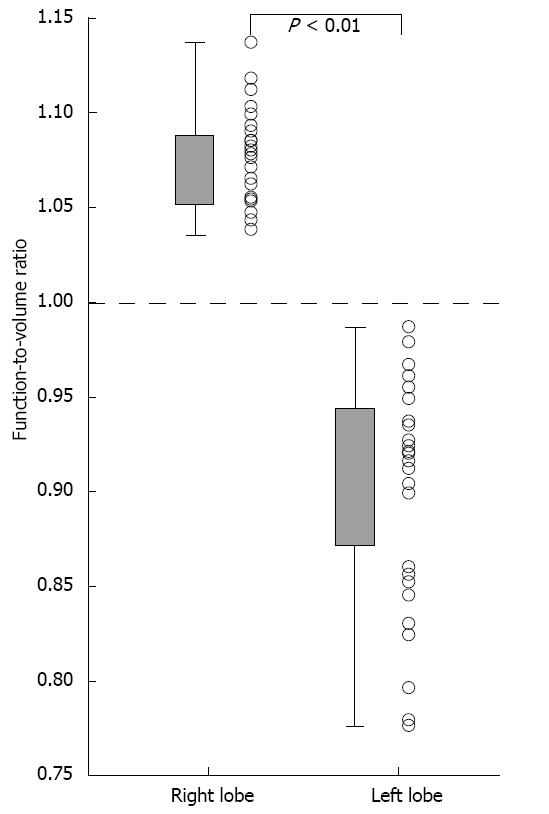
Figure 6 Comparison of the function-to-volume ratio between the right and left lobes.
The function-to-volume ratios of the right lobe were significantly higher than those of the left lobe (P < 0.01).
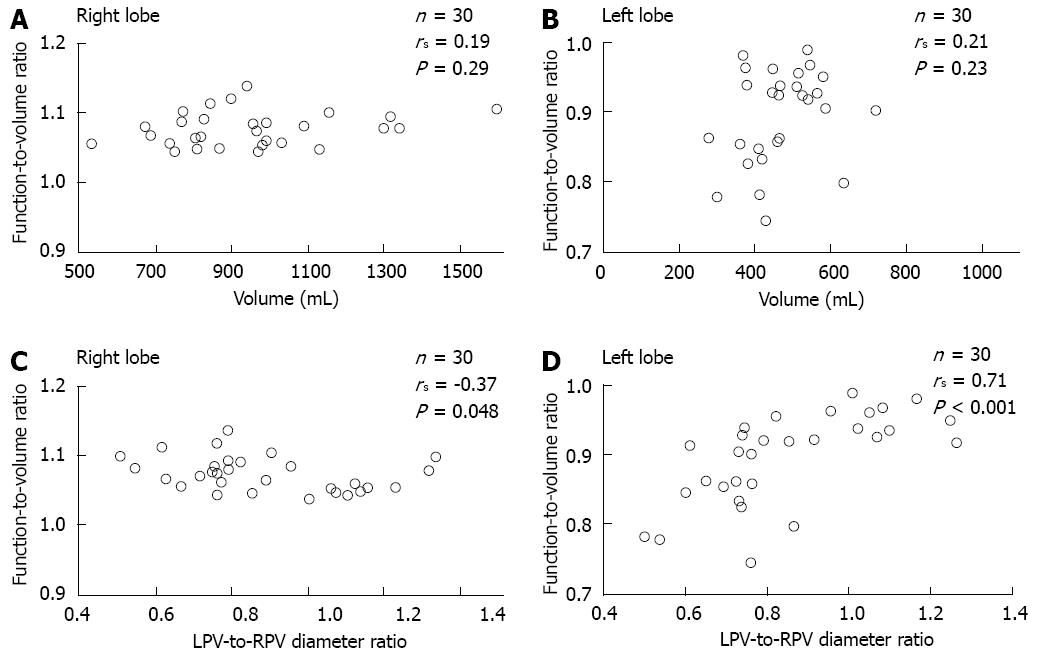
Figure 7 Correlation between the function-to-volume ratio and 2 liver parameters in each lobe.
A and B: The function-to-volume ratio showed no significant correlation with lobe volume in either lobe; C and D: The function-to-volume ratio showed a significant correlation with the ratio of the diameter of the LPV to that of the RPV in both lobes (C: Right lobe, negative correlation; D: Left lobe, positive correlation). LPV: Left portal vein; RPV: Right portal vein.
- Citation: Sumiyoshi T, Shima Y, Tokorodani R, Okabayashi T, Kozuki A, Hata Y, Noda Y, Murata Y, Nakamura T, Uka K. CT/99mTc-GSA SPECT fusion images demonstrate functional differences between the liver lobes. World J Gastroenterol 2013; 19(21): 3217-3225
- URL: https://www.wjgnet.com/1007-9327/full/v19/i21/3217.htm
- DOI: https://dx.doi.org/10.3748/wjg.v19.i21.3217


