Copyright
©2013 Baishideng Publishing Group Co.
World J Gastroenterol. May 21, 2013; 19(19): 2921-2934
Published online May 21, 2013. doi: 10.3748/wjg.v19.i19.2921
Published online May 21, 2013. doi: 10.3748/wjg.v19.i19.2921
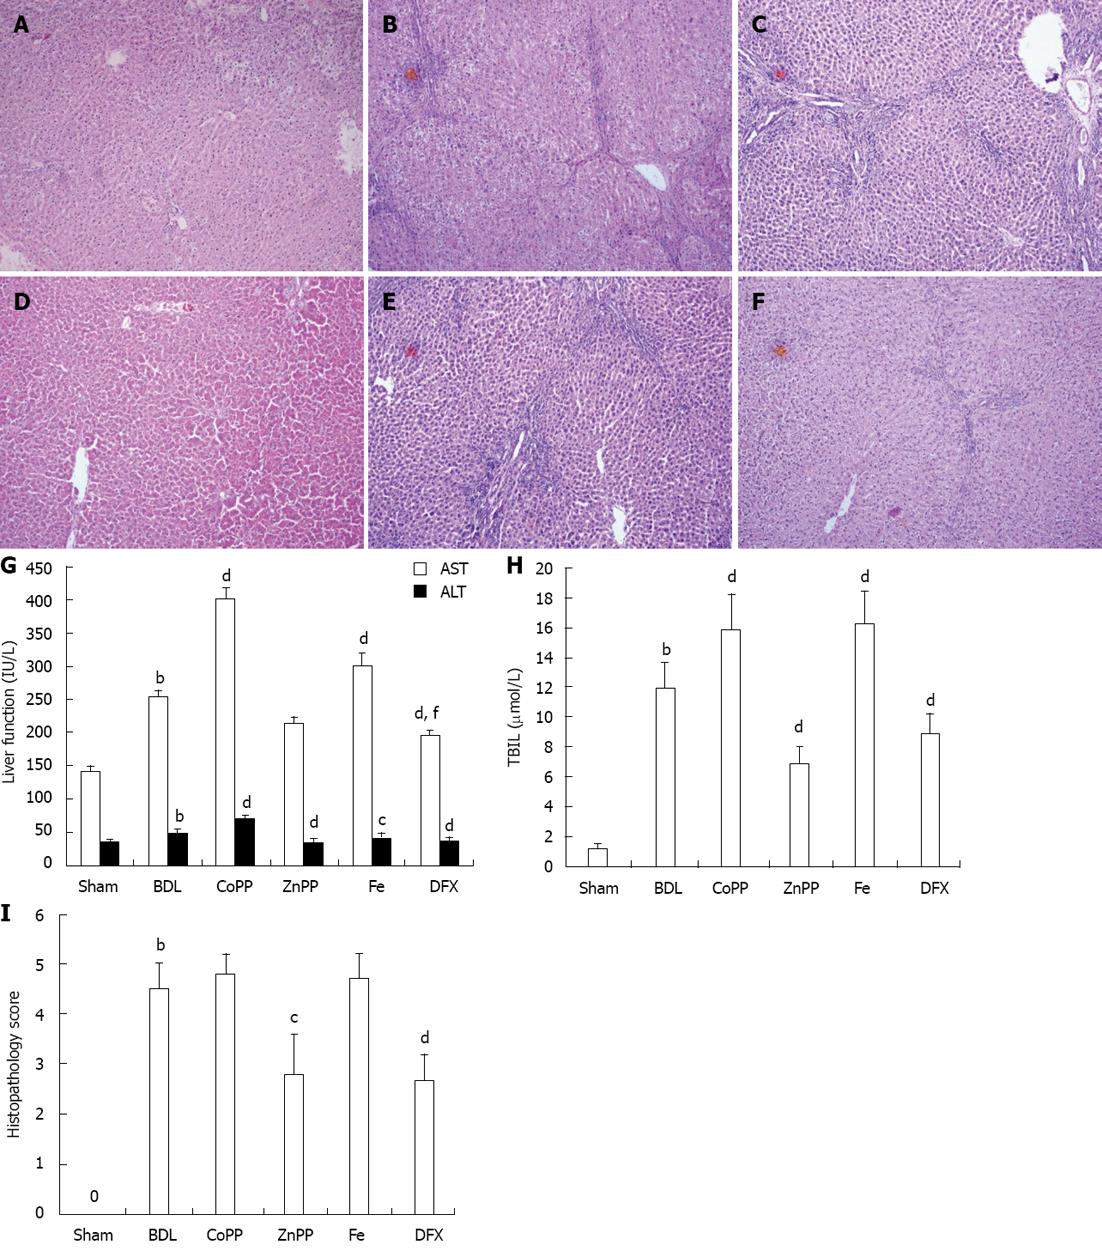
Figure 1 Pathological features of rat liver tissue detected by hematoxylin and eosin staining and serum index.
A: Normal lobular architecture in the Sham group; B, C, E: Obvious fibrous hyperplasia and fibrosis extension with fibroblast proliferation in the bile duct ligation (BDL) group, cobalt protoporphyrin (CoPP) group and Fe group; D and F: Less fibrous hyperplasia and fibrosis in the zinc protoporphyrin (ZnPP) group and deferoxamine (DFX) group; G, H: Levels of aspartate aminotransferase (AST), alanine aminotransferase (ALT) and total bilirubin (TBIL); I: Histopathological scores for fibrosis (magnification × 100). Values are expressed as mean ± SE (n = 6). bP < 0.01 vs Sham group; cP < 0.05, dP < 0.01 vs BDL group; fP < 0.01 vs ZnPP group.
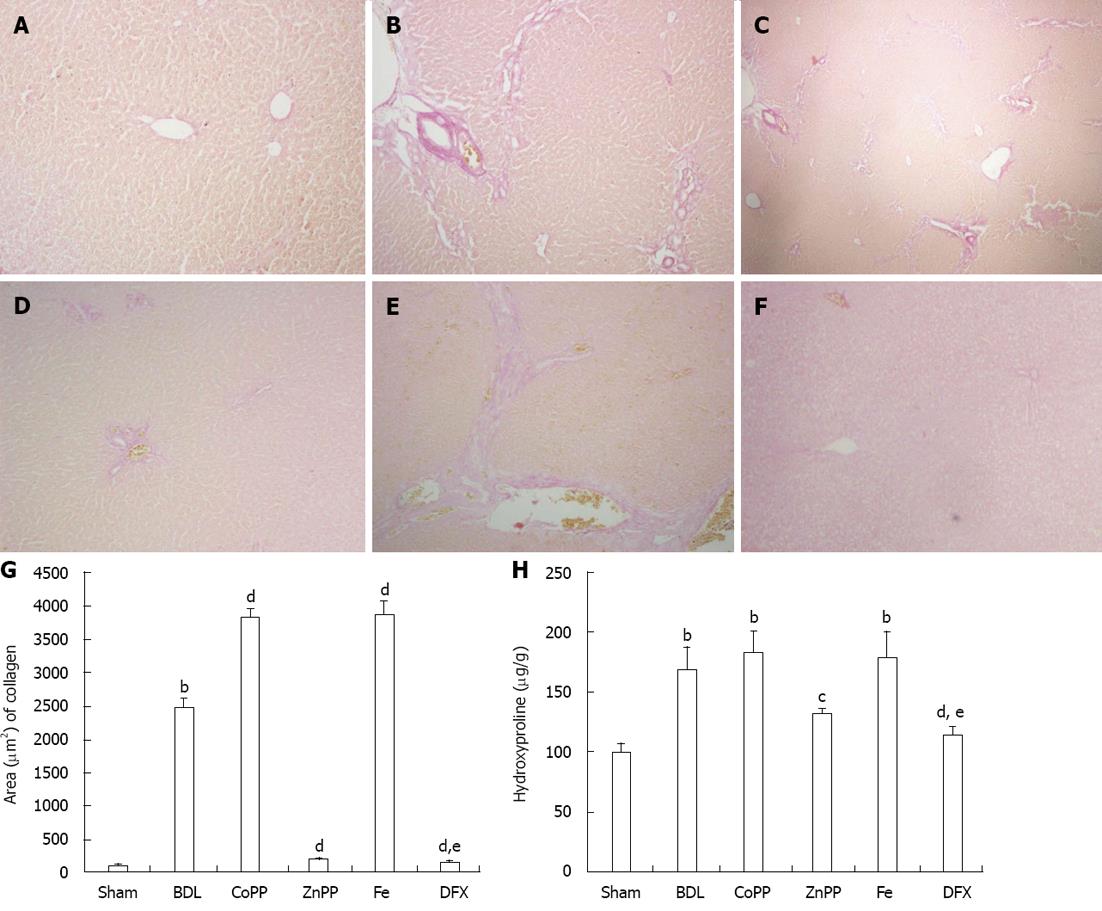
Figure 2 Van Gieson’s staining of collagen I for liver sections and liver hydroxyproline content.
A-F: Collagen type I was deposited in the bile duct ligation (BDL) group, cobalt protoporphyrin (CoPP) group and Fe group (B, C and E) and was rarely found in the Sham group, zinc protoporphyrin (ZnPP) group and deferoxamine (DFX) group (A, D and F); G: The area of collagen type I; H: Hydroxyproline content of liver tissue (magnification, × 100). Values are expressed as mean ± SE (n = 6). bP < 0.01 vs Sham group; cP < 0.05, dP < 0.01 vs BDL group; eP < 0.05 vs ZnPP group.
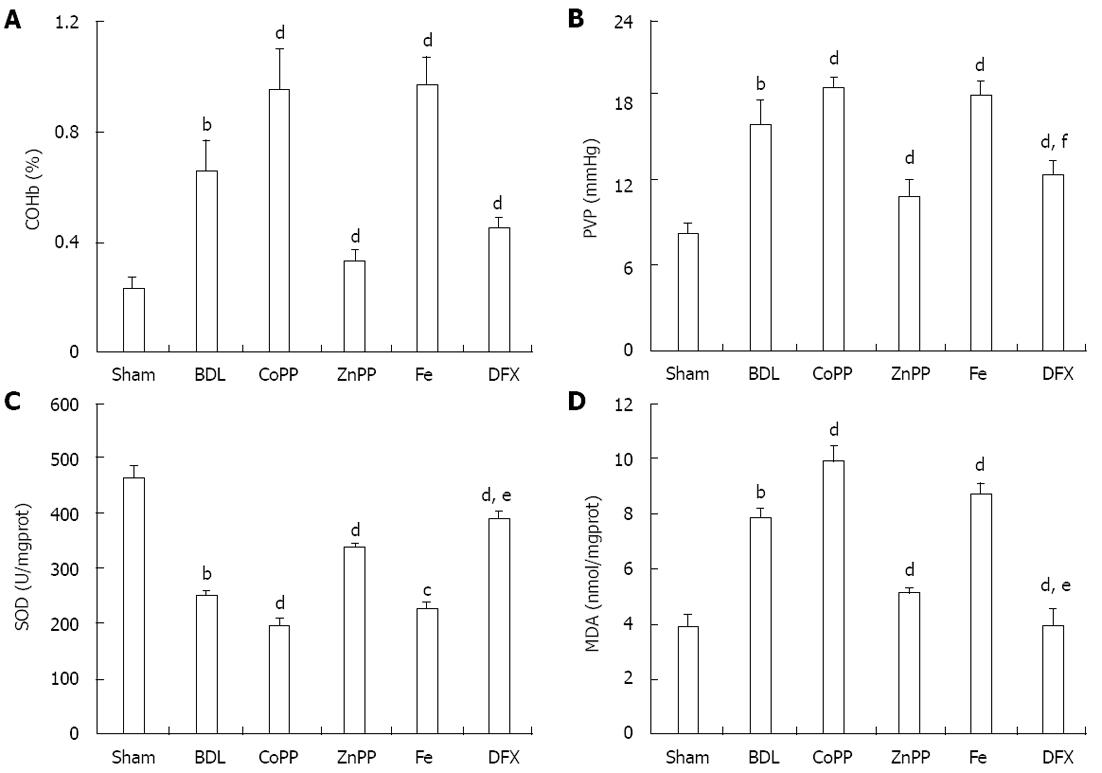
Figure 3 The levels of carboxyhemoglobin, portal vein pressure malonaldehyde and superoxide dismutase.
A, B: The levels of carboxyhemoglobin (COHb) were accordance with heme oxygenase-1 expression, and portal vein pressure (PVP) levels were measured; C, D: The levels of superoxide dismutase (SOD) and malonaldehyde (MDA) was detected. Values are expressed as mean ± SE (n = 6). bP < 0.01 vs Sham group; dP < 0.01 vs BDL group; eP < 0.05, fP < 0.01 vs zinc protoporphyrin (ZnPP) group. BDL: Bile duct ligation; CoPP: Cobalt protoporphyrin; DFX: Deferoxamine.
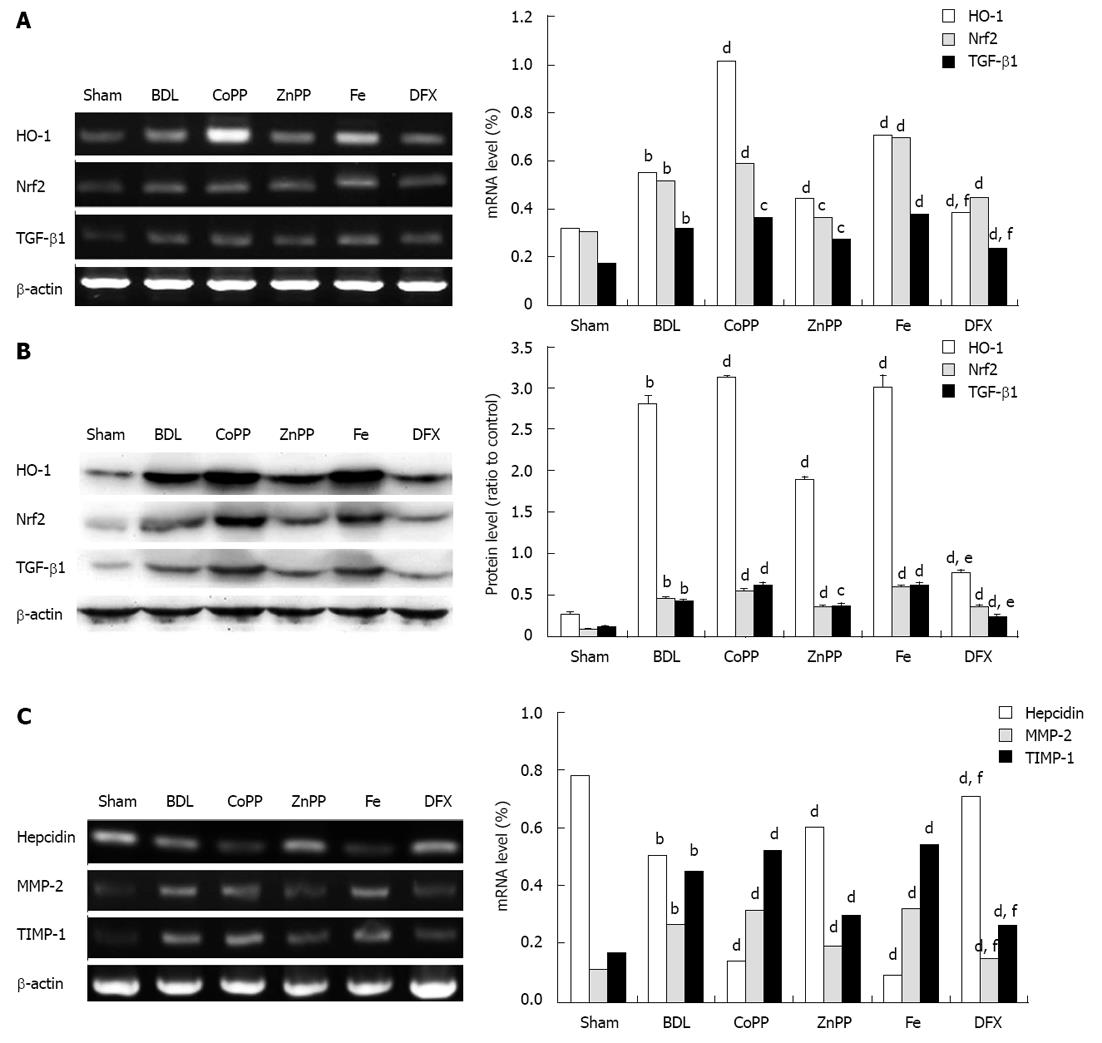
Figure 4 The heme oxygenase-1, transforming growth factor-β1, nuclear factor-E2-related factor 2, hepcidin, matrix metalloproteinase-2 and tissue inhibitor of metalloproteinase-1 expression were detected by Western blot and reverse transcription-polymerase chain reaction.
A, B: The mRNA and protein levels of heme oxygenase-1 (HO-1), transforming growth factor-β1 (TGF-β1) and nuclear factor-E2-related factor 2 (Nrf2); C: The mRNA levels of hepcidin, matrix metalloproteinase-2 (MMP-2) and tissue inhibitor of metalloproteinase-1 (TIMP-1). Values are expressed as mean ± SE. bP < 0.01 vs Sham group; cP < 0.05, dP < 0.01 vs bile duct ligation (BDL) group; eP < 0.05, fP < 0.01 vs zinc protoporphyrin (ZnPP) group. CoPP: Cobalt protoporphyrin; DFX: Deferoxamine.
Figure 5 Liver sections were stained with heme oxygenase-1 antibody.
A: Heme oxygenase-1 (HO-1) expression was less around the central veins in the Sham group; B, C, E: Much more HO-1 expression was found around the central veins in the bile duct ligation (BDL) group, cobalt protoporphyrin (CoPP) group and Fe group; D, F: Less staining was observed in the zinc protoporphyrin (ZnPP) group and deferoxamine (DFX) group; H: Immunohistochemical staining scores (magnification ×400). Values are expressed as mean ± SE (n = 6). bP < 0.01 vs Sham group; cP < 0.05, dP < 0.01 vs BDL group; fP < 0.01 vs ZnPP group.
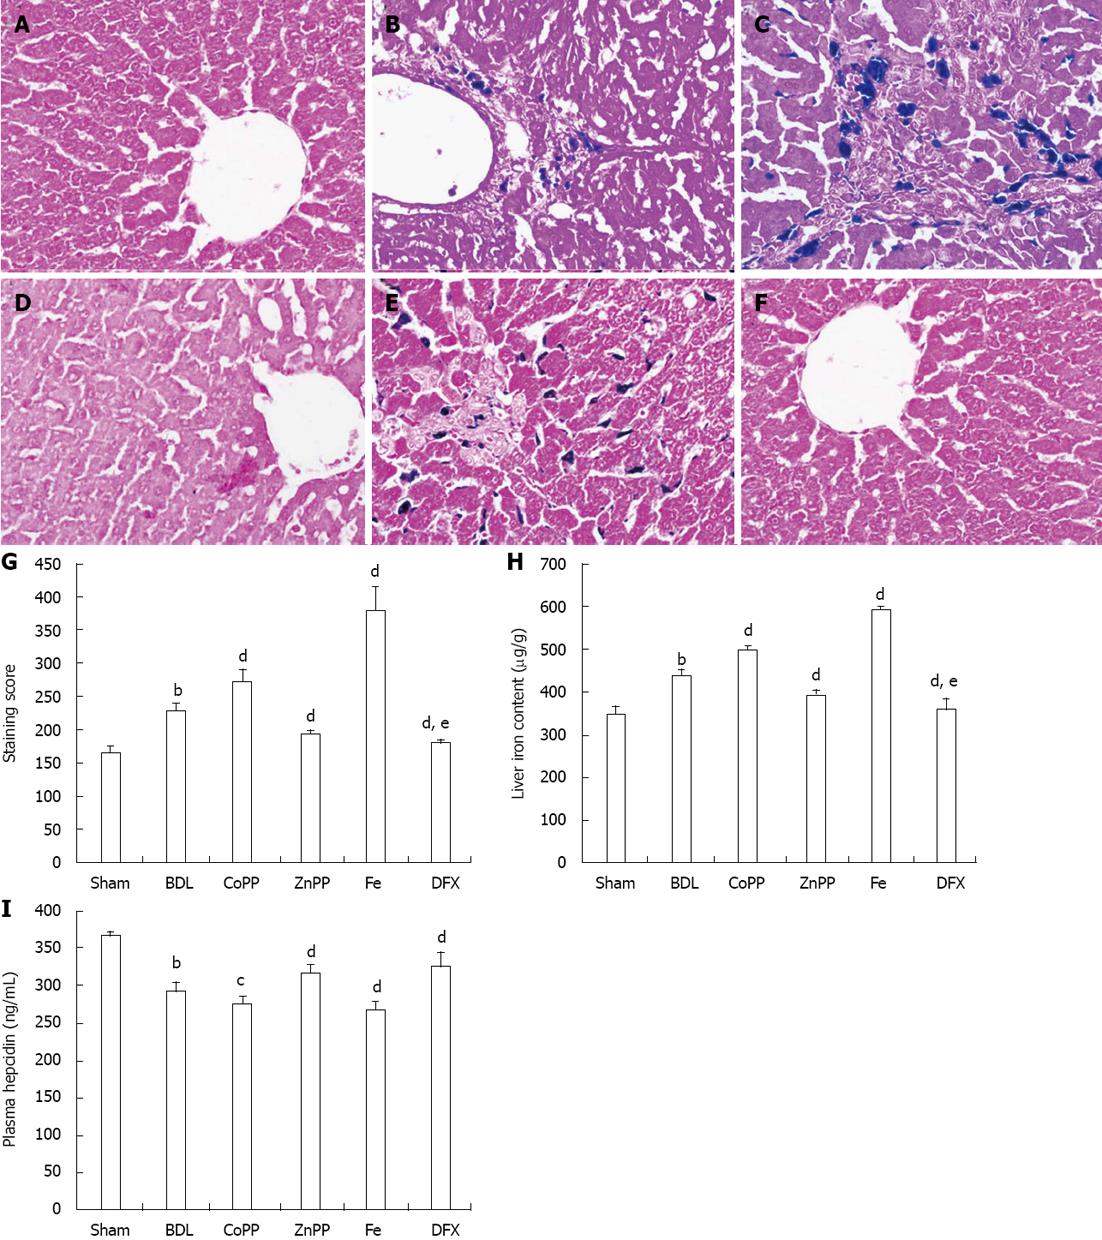
Figure 6 Perl’s Prussian blue staining, levels of hepcidin, serum and liver iron.
A: No iron accumulated in the Sham group; B: A small amount of iron mainly accumulated on Kupffer cells in the bile duct ligation (BDL) group; C: Much more iron accumulation was found in interlobular and macrophagocytes in the cobalt protoporphyrin (CoPP) group; D, F: Almost no iron accumulation was detected in the zinc protoporphyrin (ZnPP) group and deferoxamine (DFX) group; E: Massive iron accumulation was observed in the Fe group; G, H: There were no differences in the hepatic and serum iron content of these six groups; I: Plasma hepcidin also was measured by enzyme-linked immuno sorbent assay (magnification × 400). Values are expressed as mean ± SE (n = 6). bP < 0.01 vs Sham group; cP < 0.05, dP < 0.01 vs BDL group; eP < 0.05 vs ZnPP group.
Figure 7 Iron is involved in the heme oxygenase-1 cycle via the nuclear factor-E2-related factor 2/Keap1 pathway, and heme oxygenase-1 regulates portal pressure in liver cirrhosis.
Low hepcidin and heme oxygenase-1 (HO-1) over-expression could mediate iron accumulation, which accelerates oxidative stress, leading to cell injury, and it also increases HO-1 expression through the nuclear factor-E2-related factor 2 (Nrf2)/Keap1 pathway. Nrf2 protects cells against oxidative stress, but this effect is limited, and Nrf2 contributes to induction of HO-1 expression, which can produce iron. HO-1 can increase carbon monoxide (CO) production, and an unbalanced CO/nitric oxide system could play a role in portal pressure. ROS: Reactive oxygen species. ARE: Antioxidant response element.
- Citation: Wang QM, Du JL, Duan ZJ, Guo SB, Sun XY, Liu Z. Inhibiting heme oxygenase-1 attenuates rat liver fibrosis by removing iron accumulation. World J Gastroenterol 2013; 19(19): 2921-2934
- URL: https://www.wjgnet.com/1007-9327/full/v19/i19/2921.htm
- DOI: https://dx.doi.org/10.3748/wjg.v19.i19.2921


