Copyright
©2013 Baishideng Publishing Group Co.
World J Gastroenterol. May 7, 2013; 19(17): 2638-2649
Published online May 7, 2013. doi: 10.3748/wjg.v19.i17.2638
Published online May 7, 2013. doi: 10.3748/wjg.v19.i17.2638
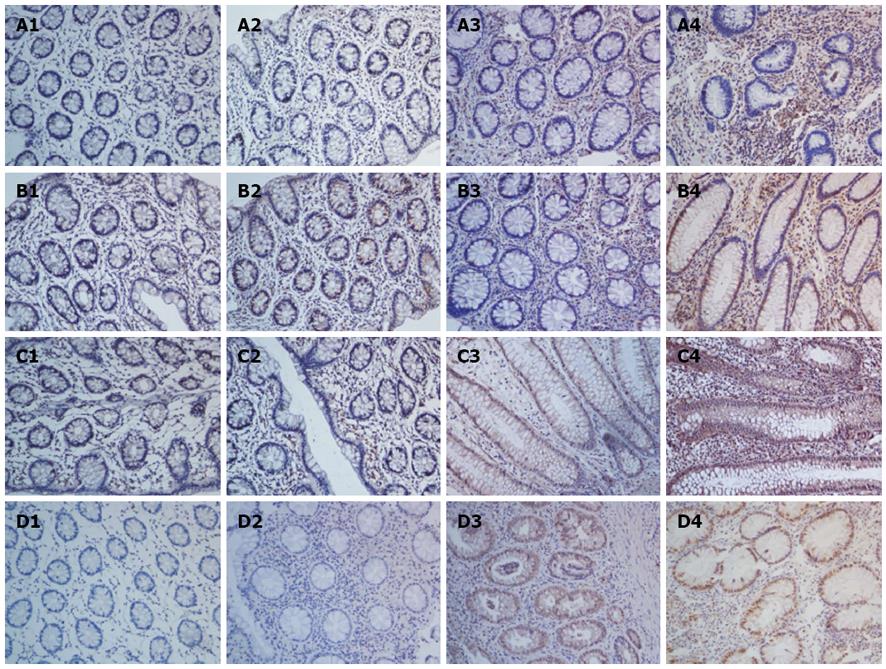
Figure 1 Expression and distribution of interleukin-22 and its related proteins in colonic biopsy specimens as analyzed by immunohistochemistry (× 200).
A1-A4: Expression and distribution of interleukin (IL)-22 in colonic biopsy specimens from the control, inactive ulcerative colitis (UC), mild-moderate UC, and severe UC tissues, respectively; B1-B4: The expression and distribution of IL-23 in colonic biopsy specimens from the control, inactive UC, mild-moderate UC, and severe UC tissues; C1-C4: The expression and distribution of IL-22R1 in colonic biopsy specimens from the control, inactive UC, mild-moderate UC, and severe UC tissues; D1-D4: The expression and distribution of p-STAT3 (S727) in colonic biopsy specimens from the control, inactive UC, mild-moderate UC, and severe UC tissues.
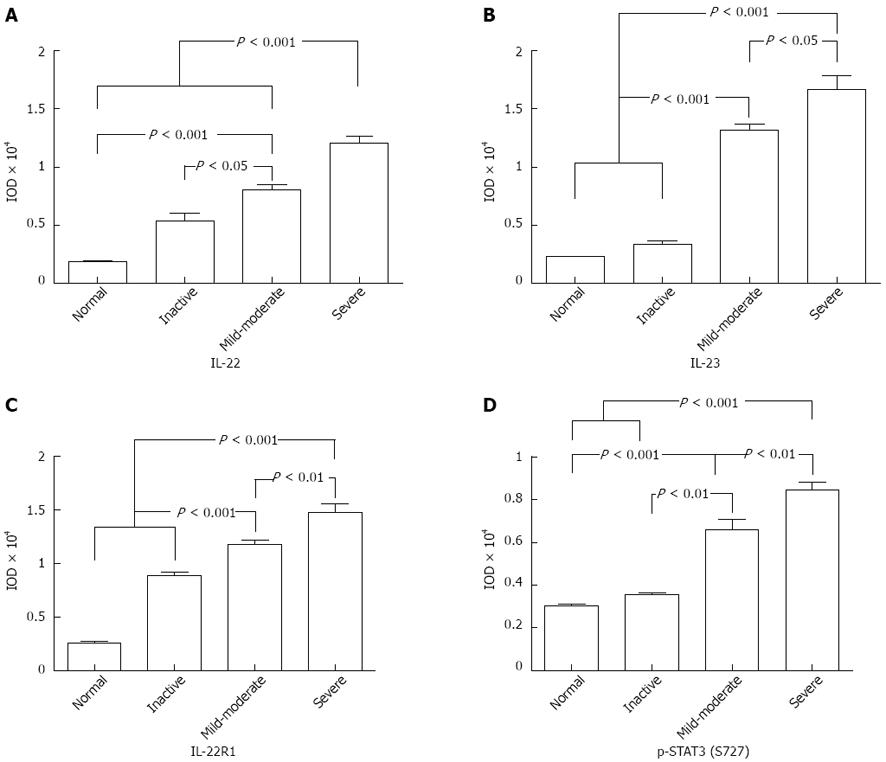
Figure 2 Statistical evaluation of interleukin-22 and its related proteins in human colonic biopsy specimens from the controls and patients with inactive, mild-moderate, and severe ulcerative colitis.
The average integrated optical density (IOD) was obtained by analyzing five random fields for each slide, which were evaluated using Image-Pro Plus software (v. 5.0), for the immunohistochemistry staining of interleukin (IL)-22 (A), IL-23 (B), IL-22R1 (C), and p-STAT3 (S727) (D) in human colonic biopsy specimens. The expression levels of IL-22 (A), IL-23 (B), IL-22R1 (C), and p-STAT3 (D) were positively correlated with colitis severity.
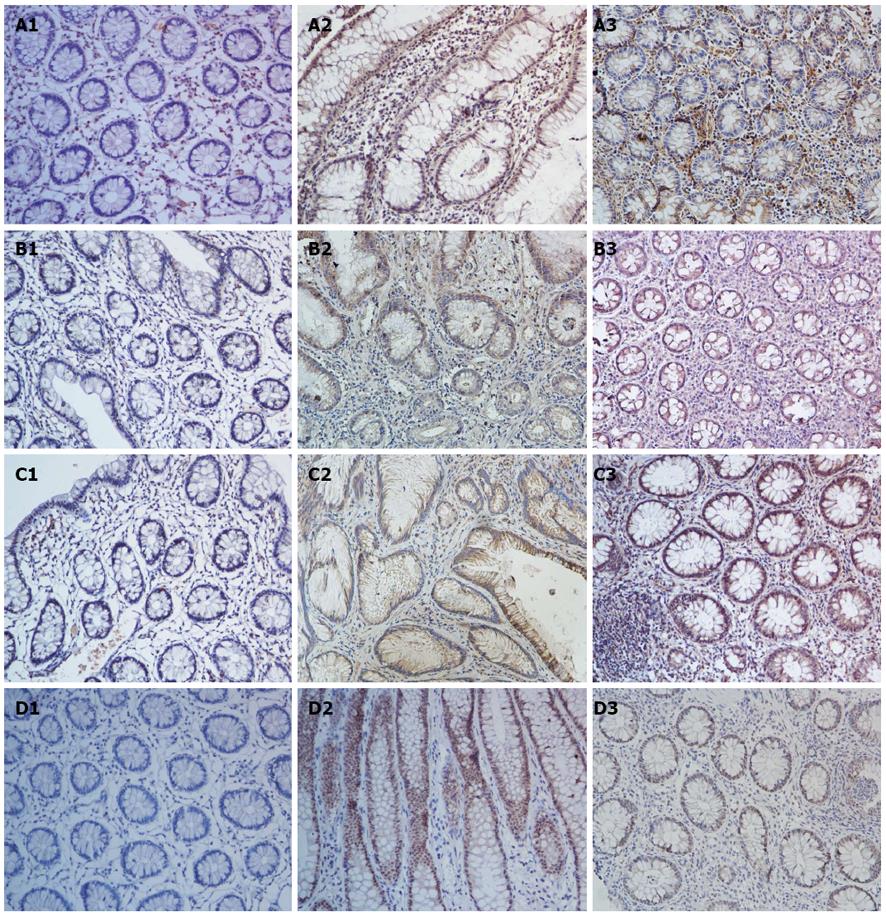
Figure 3 Expression and distribution of interleukin-22 and related proteins in human colonic tissues from controls and patients with chronic and initial ulcerative colitis as detected by immunohistochemistry (× 200).
A1-A3: Expression and distribution of interleukin (IL)-22 in ulcerative colitis (UC) tissues from the control, chronic UC, and initial UC groups; B1-B3: Expression and distribution of IL-23 in UC tissues from the control, chronic, and initial UC groups; C1-C3: Expression and distribution of IL-22R1 in UC tissues from the control, chronic, and initial UC groups; D1-D3: Expression and distribution of p-STAT3 in UC tissues from the chronic and initial UC groups.
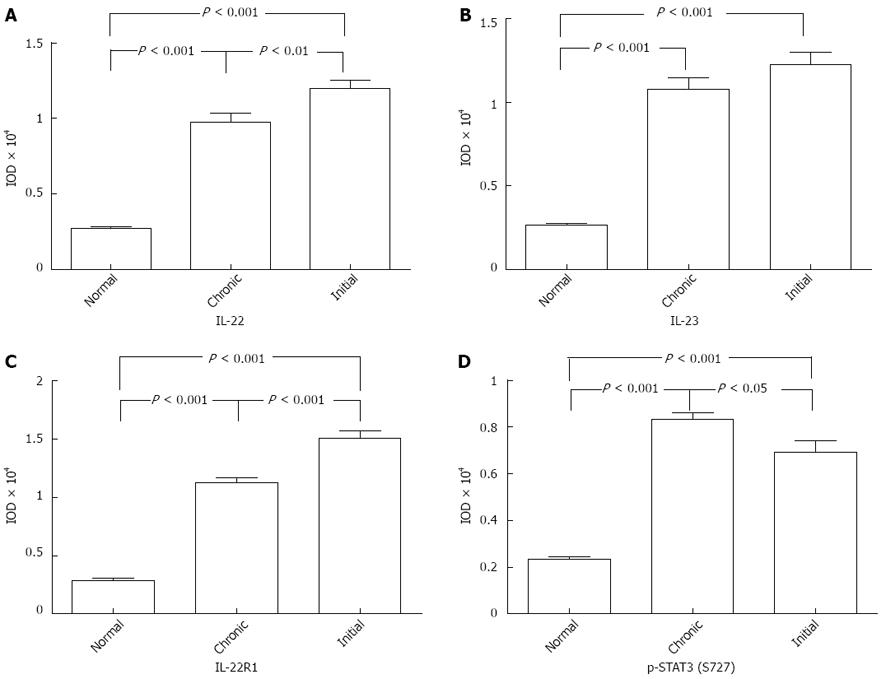
Figure 4 Statistical evaluation of interleukin-22 and its related proteins in human colonic biopsy specimens from controls and patients with chronic and initial ulcerative colitis.
The average integrated optical density (IOD) for the immunohistochemistry staining of interleukin (IL)-22 (A), IL-23 (B), IL-22R1 (C), and p-STAT3 (S727) (D) in colonic tissues with initial and chronic ulcerative colitis (UC). Significantly higher expression levels of IL-22 and IL-22R1 were observed in the initial UC group as compared with the chronic UC group. p-STAT3 was highly expressed in the chronic UC group.
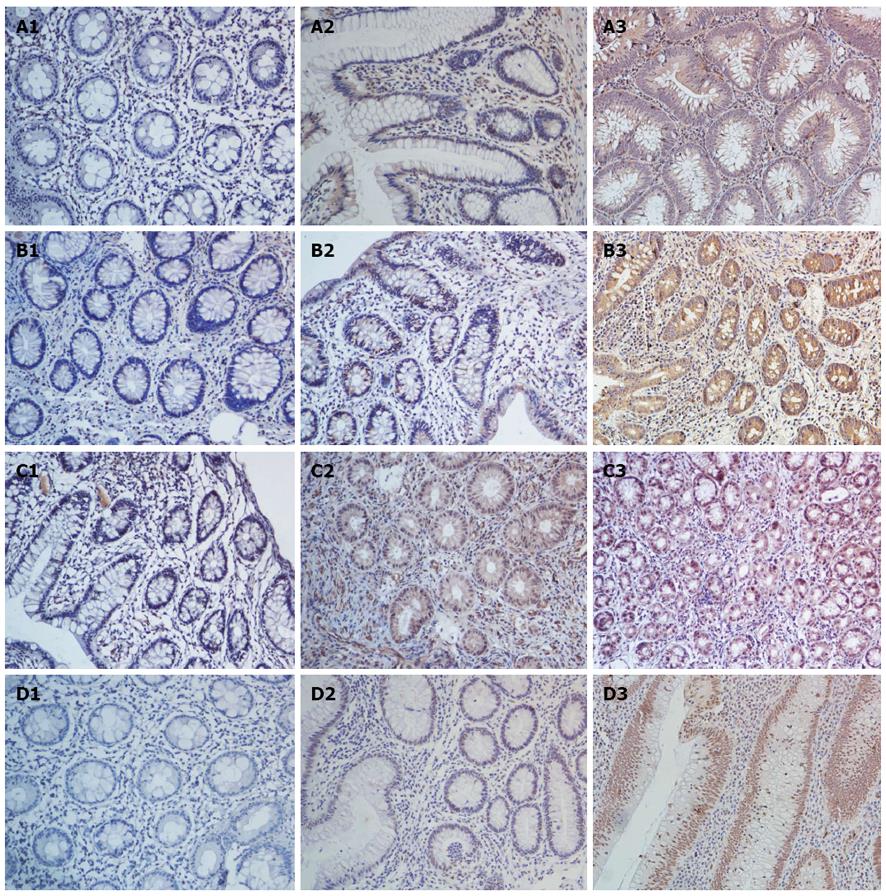
Figure 5 Expression and distribution of interleukin-22 and its related proteins in human colonic tissues from patients with inactive ulcerative colitis, active ulcerative colitis, and ulcerative colitis with dysplasia, as detected by immunohistochemistry (× 200).
A1-A3: Expression and distribution of interleukin (IL)-22 in inactive ulcerative colitis (UC), active UC, and UC with dysplasia tissues; B1-B3: Expression and distribution of IL-23 in inactive UC, active UC, and UC with dysplasia tissues; C1-C3: Expression and distribution of IL-22R1 in inactive ulcerative colitis (UC), active UC, and UC with dysplasia tissues; D1-D3: Expression and distribution of p-STAT3 (S727) in inactive UC, active UC, and UC with dysplasia tissues.
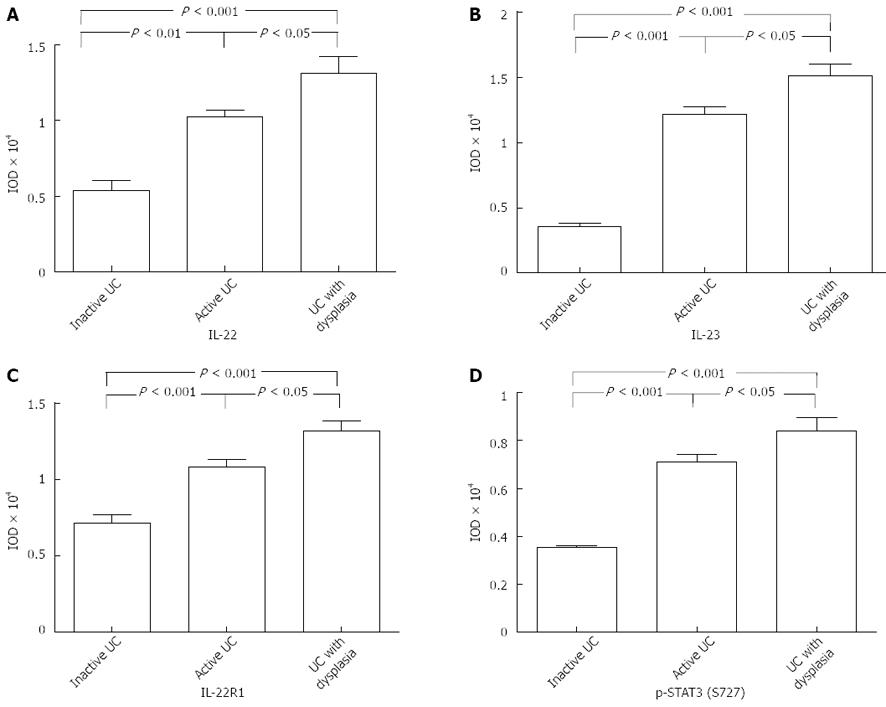
Figure 6 Statistical evaluation of interleukin-22 and its related proteins in human colonic biopsy specimens from patients with inactive ulcerative colitis, active ulcerative colitis, and ulcerative colitis with dysplasia.
The average integrated optical density (IOD) for immunohistochemistry staining of interleukin (IL)-22 (A), IL-23 (B), IL-22R1 (C), and p-STAT3 (S727) (D) in colonic tissues with ulcerative colitis (UC) and UC-related carcinogenesis (UC-CRC). Significantly higher expression levels of IL-22, IL-23, IL-22R1, and p-STAT3 were observed in the dysplasia group, as compared with the inactive and active UC groups.
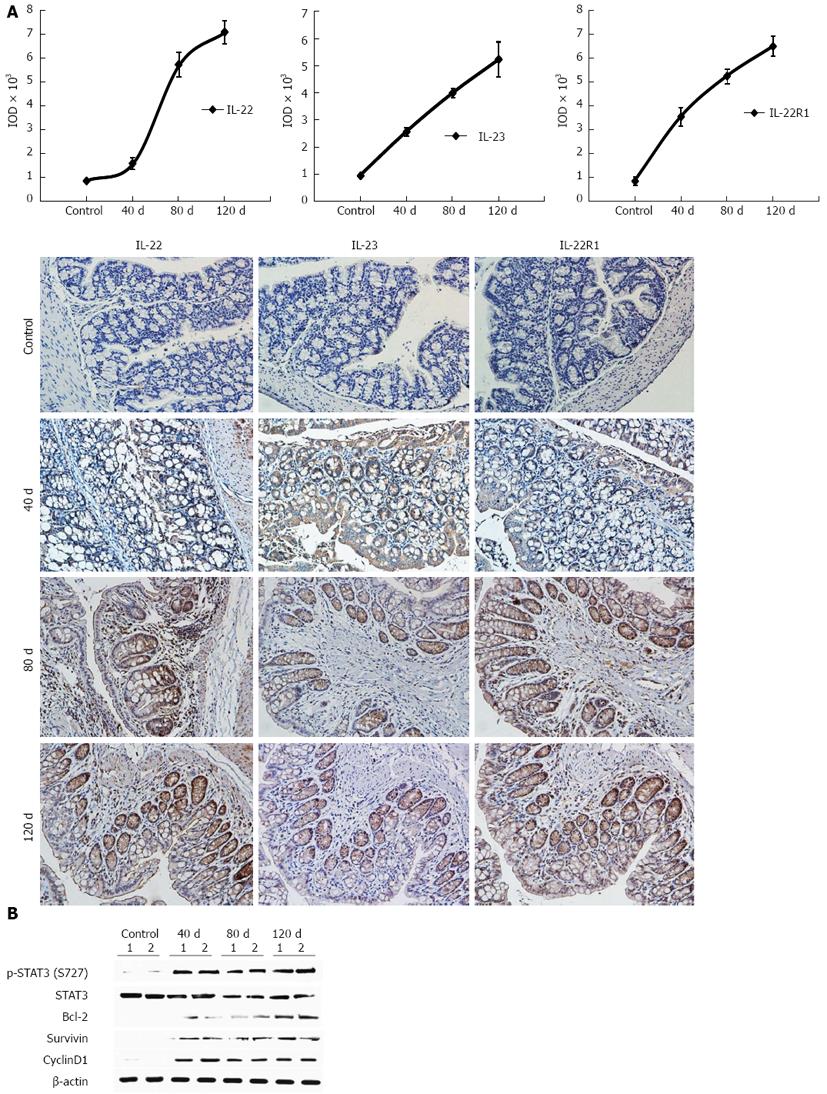
Figure 7 Expression of interleukin-22 and its related proteins in the mouse chronic colitis model.
A: The average integrated optical density (IOD) for the immunohistochemistry staining of interleukin (IL)-22, IL-23, and IL-22R1 in mouse ulcerative colitis and normal tissues at different time points: days 40, 80, and 120. The expression of IL-22, IL-22R1, and IL-23 gradually increased with time; B: Western blotting detection of p-STAT3 (S727), total STAT3, Bcl-2, survivin, and cyclin D1 after DSS administration. Expression levels were all normalized to β-actin. All genes showed sustained expression over time.
- Citation: Yu LZ, Wang HY, Yang SP, Yuan ZP, Xu FY, Sun C, Shi RH. Expression of interleukin-22/STAT3 signaling pathway in ulcerative colitis and related carcinogenesis. World J Gastroenterol 2013; 19(17): 2638-2649
- URL: https://www.wjgnet.com/1007-9327/full/v19/i17/2638.htm
- DOI: https://dx.doi.org/10.3748/wjg.v19.i17.2638


