Copyright
©2013 Baishideng Publishing Group Co.
World J Gastroenterol. Apr 14, 2013; 19(14): 2187-2196
Published online Apr 14, 2013. doi: 10.3748/wjg.v19.i14.2187
Published online Apr 14, 2013. doi: 10.3748/wjg.v19.i14.2187
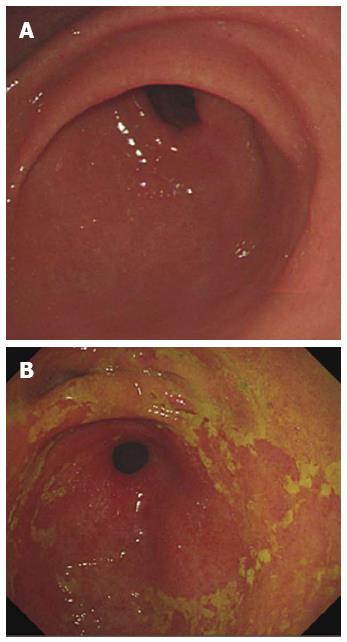
Figure 1 Comparison between the review of endoscopic evaluation control group (A) and duodenogastric reflux group (B).
Compared with control group, the gastric mucous paste of duodenogastric reflux patient is usually yellow or green and has bile dyeing like islands.
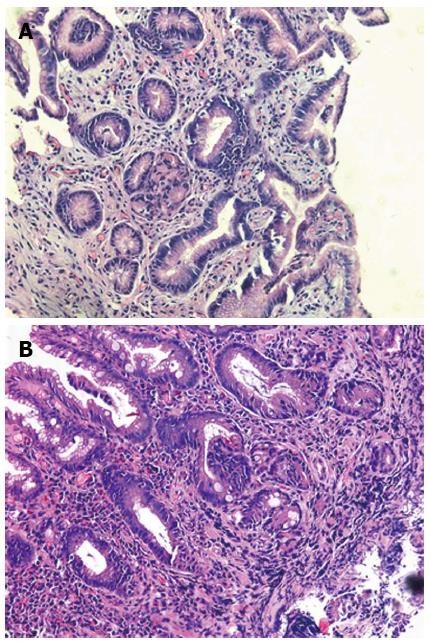
Figure 2 Representative hematoxylin and eosin staining of gastric tissue from chronic atrophic gastritis (A) and duodenogastric reflux (B).
Isolated metaplasia of glandular epithelium and mild inflammation of the lamina propria was found in the tissue of duodenogastric reflux patients (original magnification, × 200).
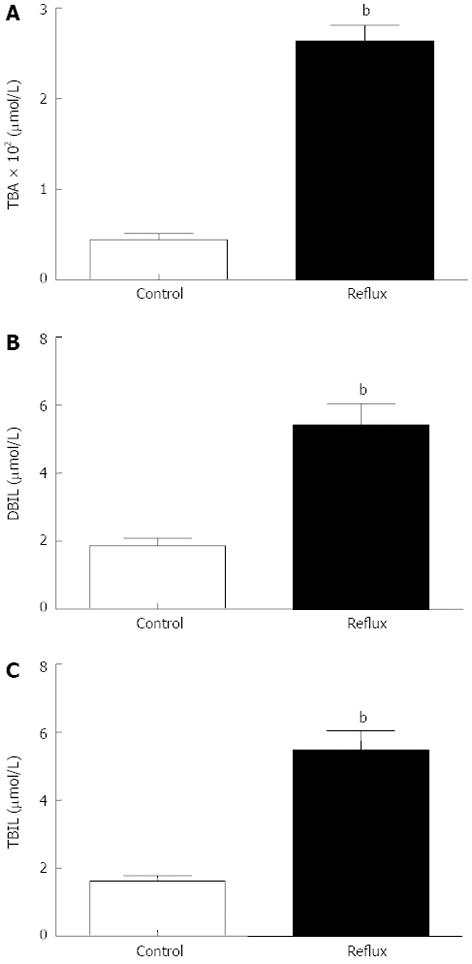
Figure 3 Intragastric concentrations of total bile acid (A), direct bilirubin (B) and total bilirubin (C) aspirated in endoscopy examination in duodenogastric reflux group and control group.
Patients with duodenogastric reflux had a significantly higher total bile acid (TBA), total bilirubin (TBIL) and direct bilirubin (DBIL) compared to controls (bP < 0.001 vs control group). Data are expressed as mean ± SE and difference was calculated using the independent-samples Mann-Whitney U-test.
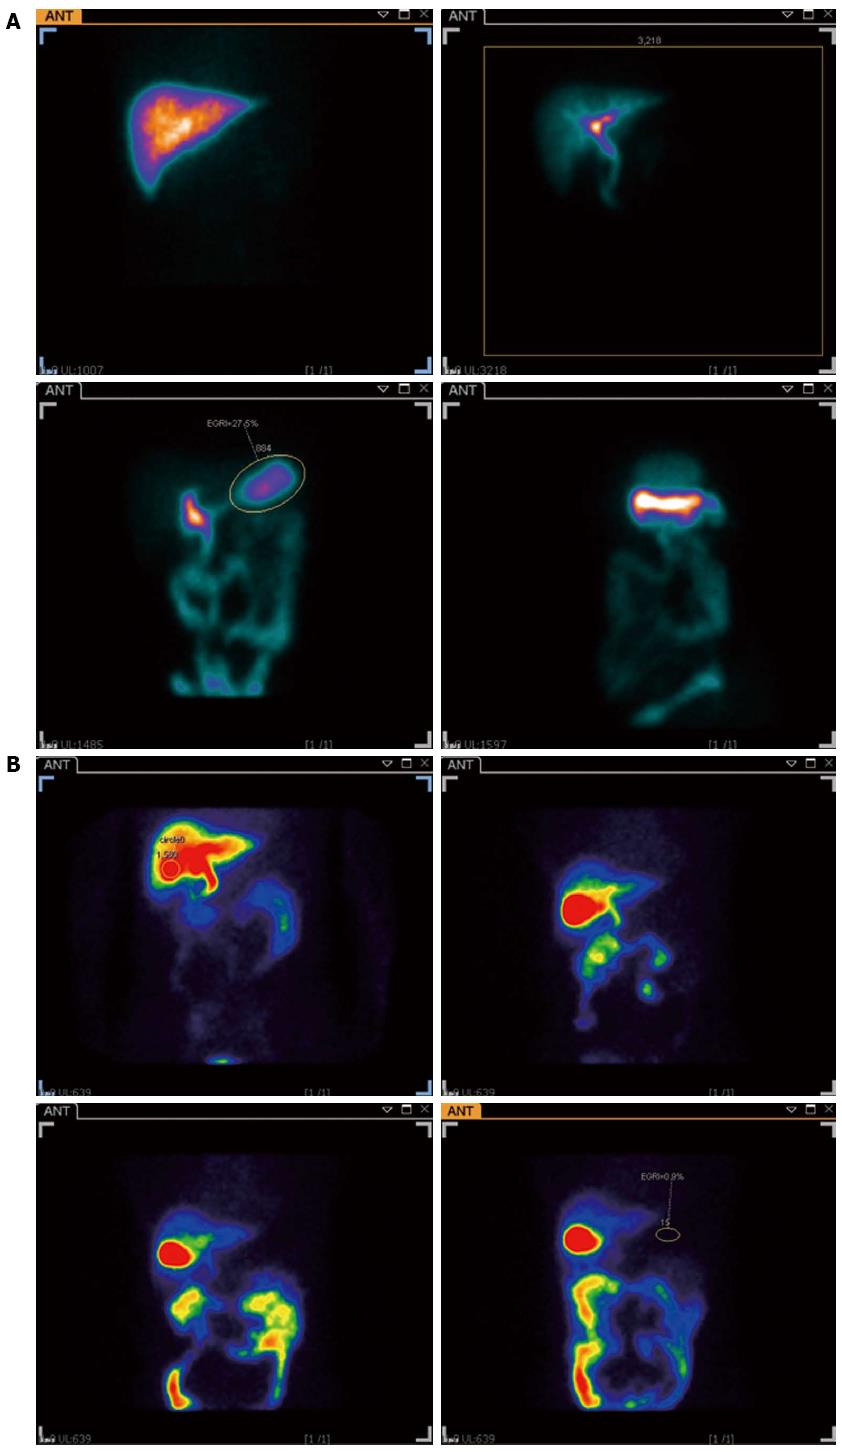
Figure 4 Examination of duodenogastric reflux by 99mTc-ethyl hepatic iminodiacetic acid test.
A: One episode of duodenogastric reflux, of which the duodenogastric reflux index is 27.5%, is shown in the gastric localization (yellow circle) in the third image; B: A normal study in which no reflux is seen in the gastric region (yellow circle) outlined in the last picture.
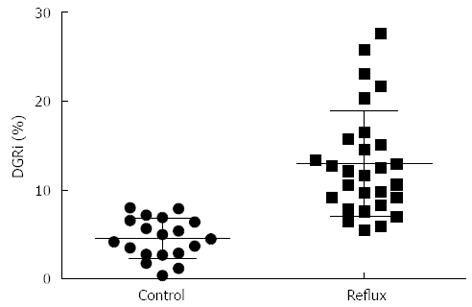
Figure 5 Comparison of duodenogastric reflux group and control group in the scintigraphy.
The reflux rates of duodenogastric reflux group in the patients were higher than those in the control group with statistically significant differences (Z = -5.224, P < 0.001). Data was calculated using the independent-samples Mann-Whitney U-test. DGRi: Duodenogastric reflux index.
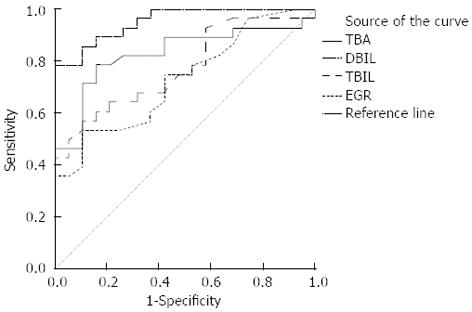
Figure 6 Receiver operator curve for 99mTc-ethyl hepatic iminodiacetic acid test and gastric juice analyses in the diagnosis of duodenogastric reflux.
Area under the curve was of 0.953 for ethyl hepatic iminodiacetic acid scintigraphy (P < 0.001, 95%CI: 0.901-1.000), 0.830 for total bile acid (TBA) (P < 0.001, 95%CI: 0.709-0.950), 0.722 for direct bilirubin (DBIL) (P = 0.008, 95%CI: 0.587-0.872) and 0.773 for total bilirubin (TBIL) (P = 0.002, 95%CI: 0.642-0.905).
- Citation: Chen TF, Yadav PK, Wu RJ, Yu WH, Liu CQ, Lin H, Liu ZJ. Comparative evaluation of intragastric bile acids and hepatobiliary scintigraphy in the diagnosis of duodenogastric reflux. World J Gastroenterol 2013; 19(14): 2187-2196
- URL: https://www.wjgnet.com/1007-9327/full/v19/i14/2187.htm
- DOI: https://dx.doi.org/10.3748/wjg.v19.i14.2187


