Copyright
©2013 Baishideng Publishing Group Co.
World J Gastroenterol. Jan 7, 2013; 19(1): 57-64
Published online Jan 7, 2013. doi: 10.3748/wjg.v19.i1.57
Published online Jan 7, 2013. doi: 10.3748/wjg.v19.i1.57
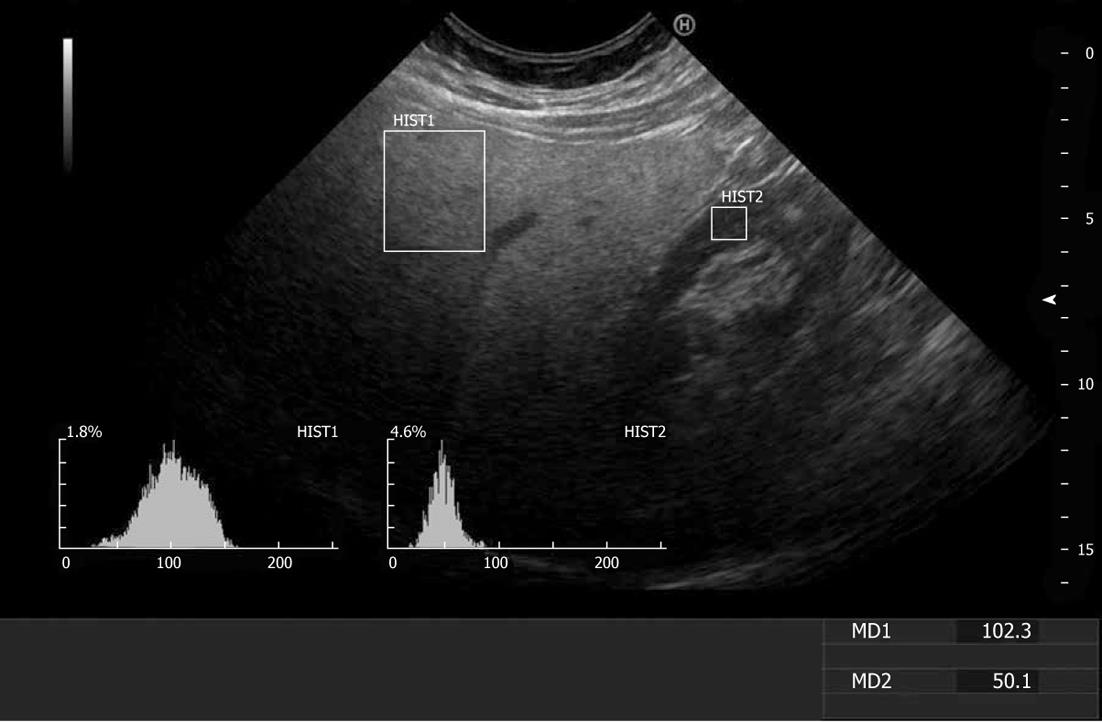
Figure 1 Ultrasound image of the liver and the right kidney cortex with graphic representation of the histogram in the region of interest rectangle.
HIST1 is the histogram of the liver and HIST2 is the histogram of the right kidney cortex. The median histogram (MD) 1 of the liver is 102.3 and the MD2 of the kidney cortex is 50.1, yielding an HRI of 2.04.
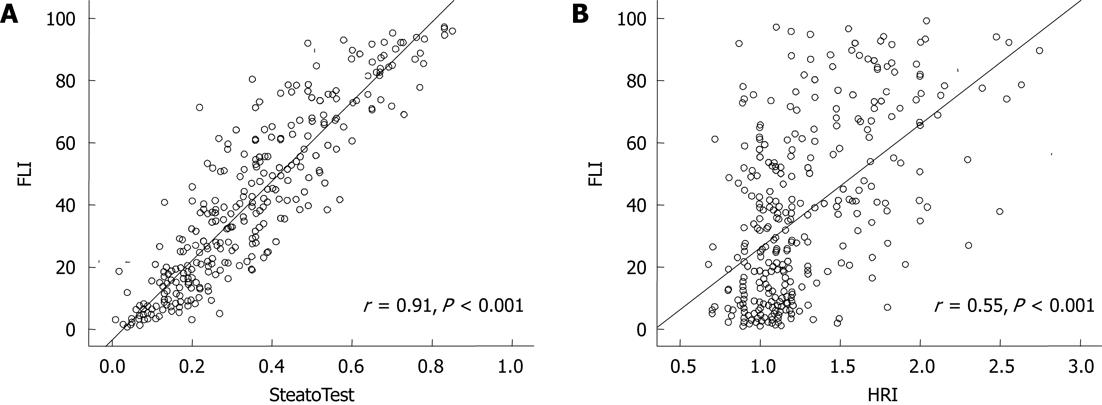
Figure 2 Correlation of fatty liver index with the reference methods.
A: SteatoTest; B: Hepatorenal ultrasound index (HRI). FLI: Fatty liver index.
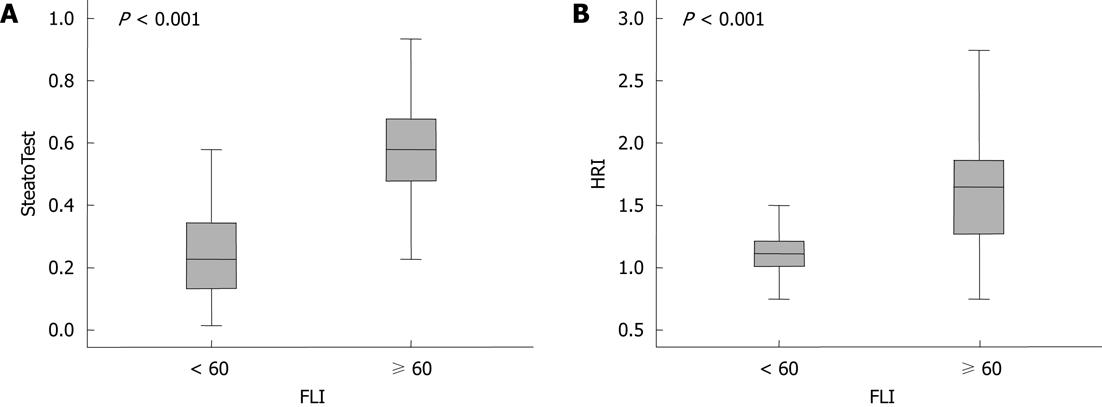
Figure 3 Distribution of SteatoTest and hepatorenal ultrasound index by fatty liver index above and below 60.
A: SteatoTest; B: Hepatorenal ultrasound index (HRI). The box represents the interquartile range. The line across the box indicates the median. The “whiskers” are lines that extend from the box to the highest and lowest values, excluding outliers (defined as observations greater than 1.5 interquartile ranges). FLI: Fatty liver index.
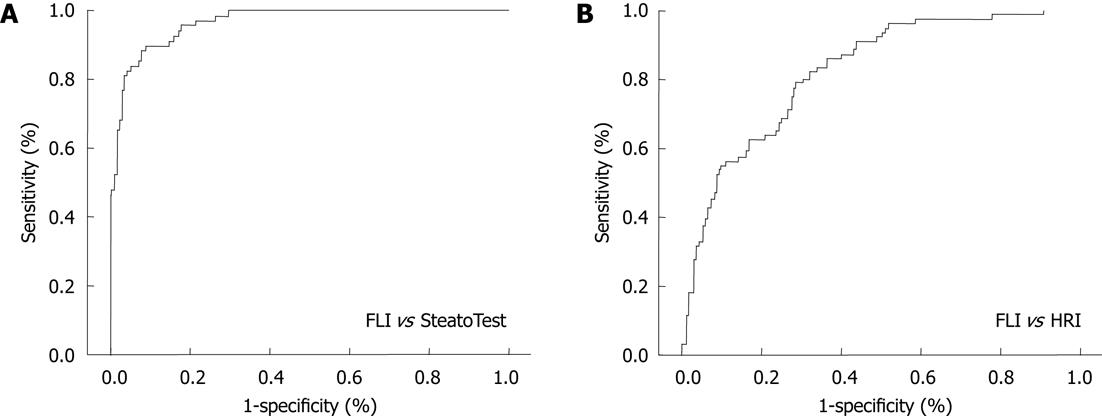
Figure 4 Receiver operating characteristic curves for diagnostic accuracy of fatty liver index vs SteatoTest or hepatorenal ultrasound index.
A: SteatoTest; B: Hepatorenal ultrasound index (HRI). Comparing fatty liver index (FLI) to SteatoTest ≥ S2, area under the receiver operating characteristic curve (AUROC) was 0.97 (95% CI: 0.95-0.98). Comparing FLI to HRI ≥ 1.5, AUROC was 0.82 (95% CI: 0.77-0.87). Receiver operating characteristic curve of sensitivity (true-positive fraction) plotted against 1- specificity (false-positive fraction) of the FLI for diagnosis of steatosis.
- Citation: Zelber-Sagi S, Webb M, Assy N, Blendis L, Yeshua H, Leshno M, Ratziu V, Halpern Z, Oren R, Santo E. Comparison of fatty liver index with noninvasive methods for steatosis detection and quantification. World J Gastroenterol 2013; 19(1): 57-64
- URL: https://www.wjgnet.com/1007-9327/full/v19/i1/57.htm
- DOI: https://dx.doi.org/10.3748/wjg.v19.i1.57


