Copyright
©2012 Baishideng Publishing Group Co.
World J Gastroenterol. Dec 14, 2012; 18(46): 6771-6781
Published online Dec 14, 2012. doi: 10.3748/wjg.v18.i46.6771
Published online Dec 14, 2012. doi: 10.3748/wjg.v18.i46.6771
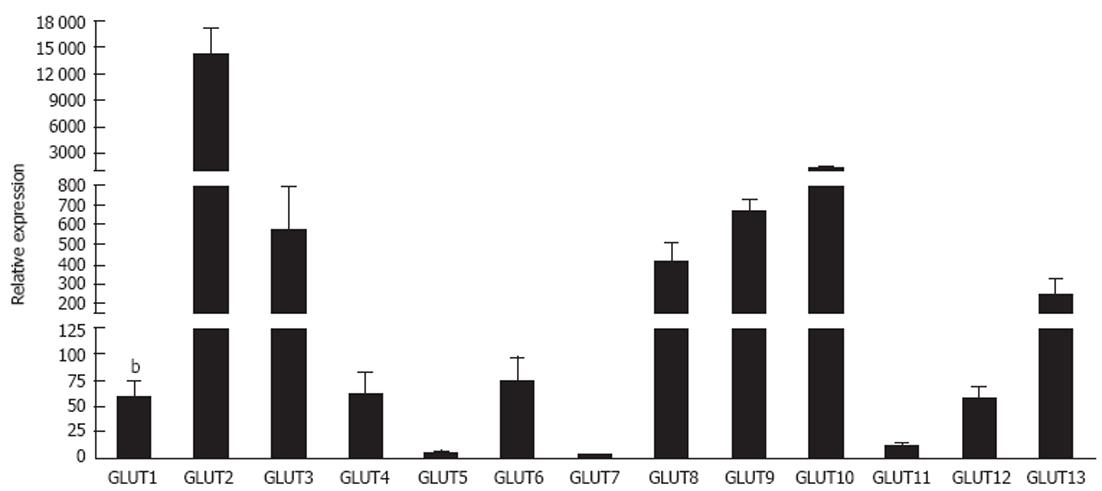
Figure 1 Expression of glucose transporter glucose transporters 1-13 micro RNA in normal human livers.
This figure contains unpublished data generated by the authors. Livers were collected from patients at the Liver Unit, Queen Elizabeth Hospital, Birmingham, United Kingdom with appropriate informed written consent and local ethics committee approval. Micro RNA was extracted using standard protocols and integrity was confirmed using an Agilent 2100 Bioanalyser. Transcriptome analysis was carried out for all samples using Agilent Human Whole Genome Oligo Arrays (G4112F) in accordance with Agilent one colour microarray gene expression analysis protocol. Results are expressed as means of five normal livers ± SE, and were run on triplicate plates. Data were normalized to pooled endogenous controls and differential expression is represented as power 2-ΔCT. bP < 0.01 vs glucose transporters (GLUT) 2.
- Citation: Karim S, Adams DH, Lalor PF. Hepatic expression and cellular distribution of the glucose transporter family. World J Gastroenterol 2012; 18(46): 6771-6781
- URL: https://www.wjgnet.com/1007-9327/full/v18/i46/6771.htm
- DOI: https://dx.doi.org/10.3748/wjg.v18.i46.6771


