Copyright
©2012 Baishideng Publishing Group Co.
World J Gastroenterol. Nov 28, 2012; 18(44): 6409-6419
Published online Nov 28, 2012. doi: 10.3748/wjg.v18.i44.6409
Published online Nov 28, 2012. doi: 10.3748/wjg.v18.i44.6409
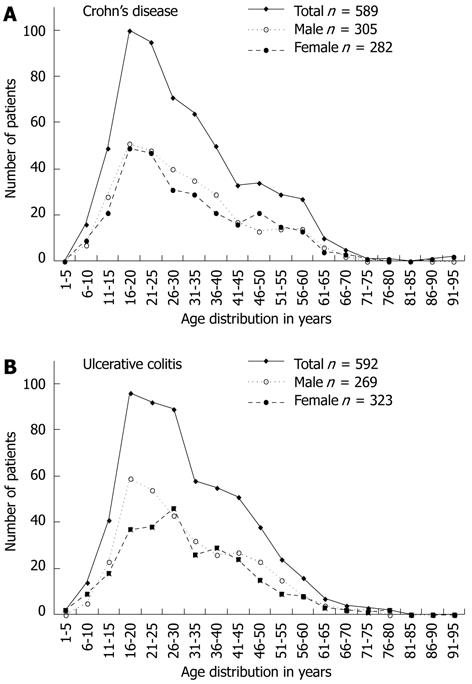
Figure 1 Incidence curves, given as a mean of 5 consecutive years, are shown for the inflammatory bowel disease study cohort.
Curves separated by gender and displaying the total inflammatory bowel disease cohort are included.
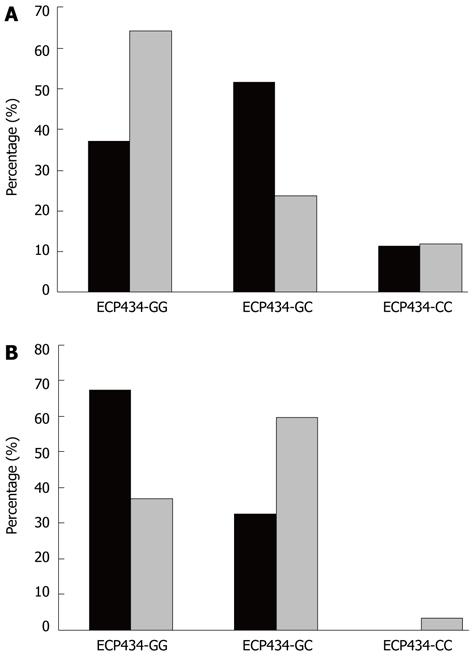
Figure 2 Prevalence of ECP434 genotypes in Crohn’s disease (black bars) and ulcerative colitis (grey bars).
A: In females, age at disease diagnosis (ADD) > 45 years, a significant difference between Crohn’s disease (CD) and ulcerative colitis (UC) concerning ECP434 (P = 0.01, χ2) was observed; B: In men, ADD > 45 years a significant difference between CD and UC concerning ECP434 (P = 0.004) was observed. ECP: Eosinophil cationic protein.
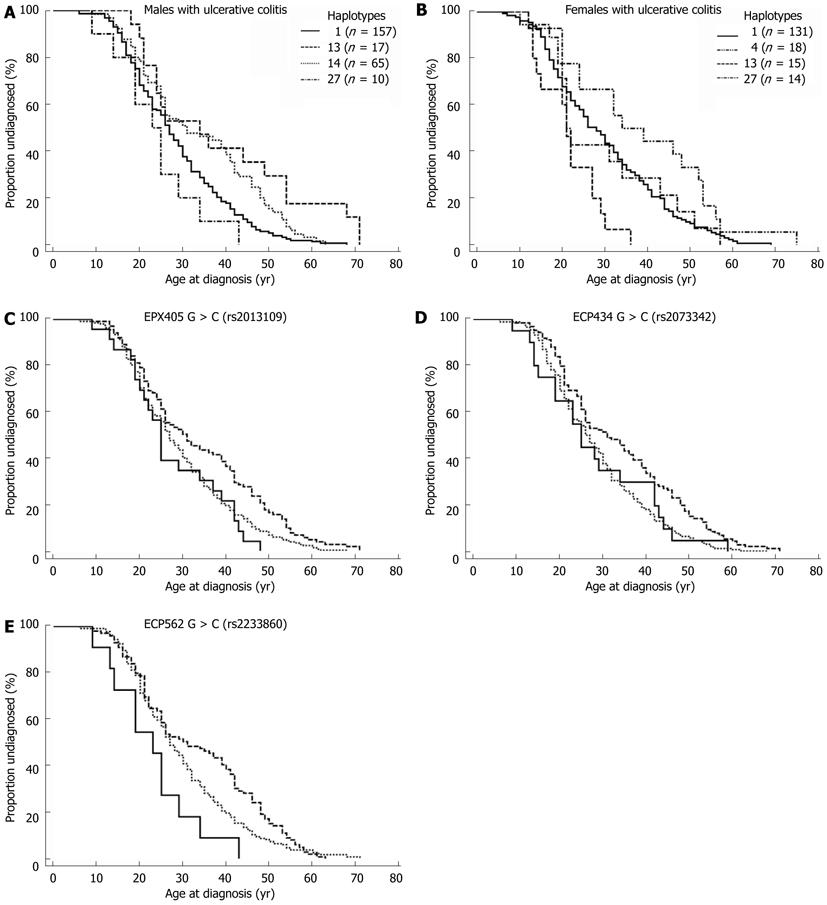
Figure 3 Kaplan-Meier Curve of four groups haplotypes and EPX405, ECP562 genotypes.
A: Kaplan-Meier Curve of four groups of haplotypes in male patients with ulcerative colitis (UC) (P = 0.0009); B: Kaplan-Meier Curve of four groups of haplotypes in female patients with Crohn’s disease (P = 0.003); C: Kaplan-Meier curve of the EPX405 genotype in men with UC (P = 0.007); D: Curve of the ECP434 genotype in men with UC (P = 0.002); E: Curve of the ECP562 genotype in males with UC (P = 0.01). Dotted line: GG genotype; Dashed line: GC genotype; Continuous line: CC genotype. ECP: Eosinophil cationic protein; EPX: Eosinophil protein X.
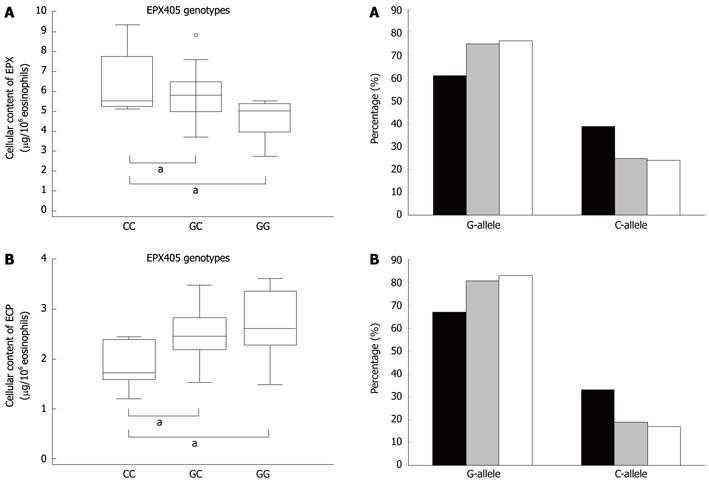
Figure 4 The box plots displays the association between the EPX405 genotypes and the intracellular content of eosinophil protein X and eosinophil cationic protein in eosinophils.
The box plots display the distribution of the protein content within each class of genotype. A: Intracellular content of eosinophil protein X (EPX) (ANOVA P = 0.009). aP < 0.05 vs EPX405 GG genotype (Student-Newman-Keuls test); B: Intracellular content of eosinophil cationic protein (ANOVA P = 0.022). aP < 0.05 vs the EPX405 CC genotype (Student-Newman-Keuls test).
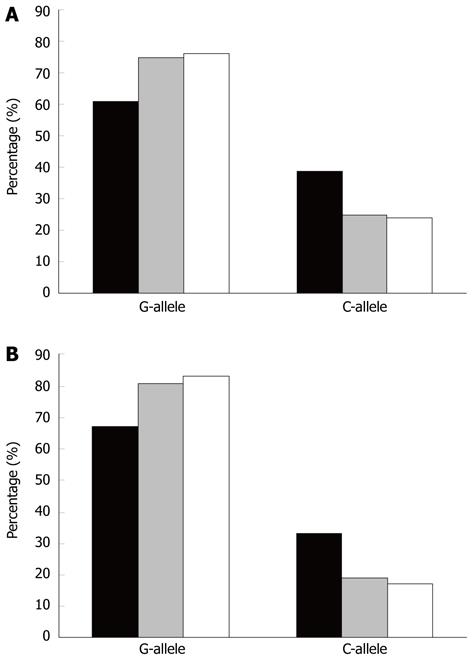
Figure 5 Distribution of allele frequencies, displaying the difference in patients with ulcerative colitis and dysplasia/cancer.
Bars represent the allele frequency (%) of ECP434 (A) and ECP562 (B) single nucleotide polymorphism in patients with dysplasia/cancer (black bar), all patients with ulcerative colitis (grey bar), and healthy individuals (white bar). ECP: Eosinophil cationic protein.
- Citation: Blom K, Rubin J, Halfvarson J, Törkvist L, Rönnblom A, Sangfelt P, Lördal M, Jönsson UB, Sjöqvist U, Håkansson LD, Venge P, Carlson M. Eosinophil associated genes in the inflammatory bowel disease 4 region: Correlation to inflammatory bowel disease revealed. World J Gastroenterol 2012; 18(44): 6409-6419
- URL: https://www.wjgnet.com/1007-9327/full/v18/i44/6409.htm
- DOI: https://dx.doi.org/10.3748/wjg.v18.i44.6409


