Copyright
©2012 Baishideng Publishing Group Co.
World J Gastroenterol. Nov 7, 2012; 18(41): 5999-6002
Published online Nov 7, 2012. doi: 10.3748/wjg.v18.i41.5999
Published online Nov 7, 2012. doi: 10.3748/wjg.v18.i41.5999
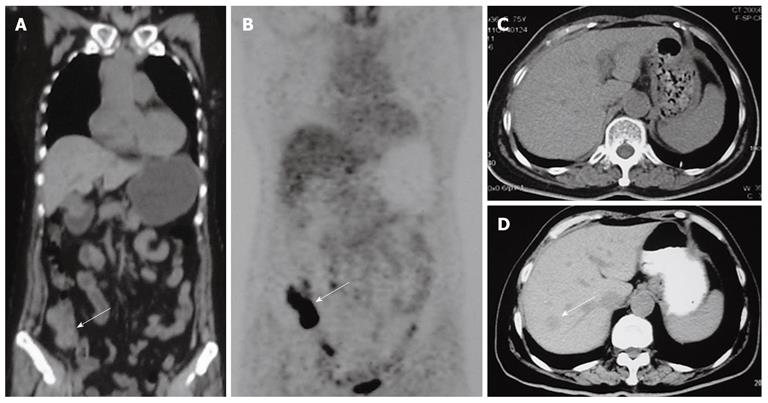
Figure 1 Positron emission tomography plus computed tomography and computed tomography scan findings in our patient.
A: Positron emission tomography plus computed tomography (PET/CT) scan showed thickening of the ileocecal region (white arrow), and no liver lesions; B: PET/CT scan showed increased metabolic areas in the ileocecal region (white arrow), no increased metabolic areas in the liver; C: Six months later a follow-up CT scan showed no liver lesions; D: Eleven months later a follow-up CT scan showed one low-density lesion in the right liver lobe (white arrow).
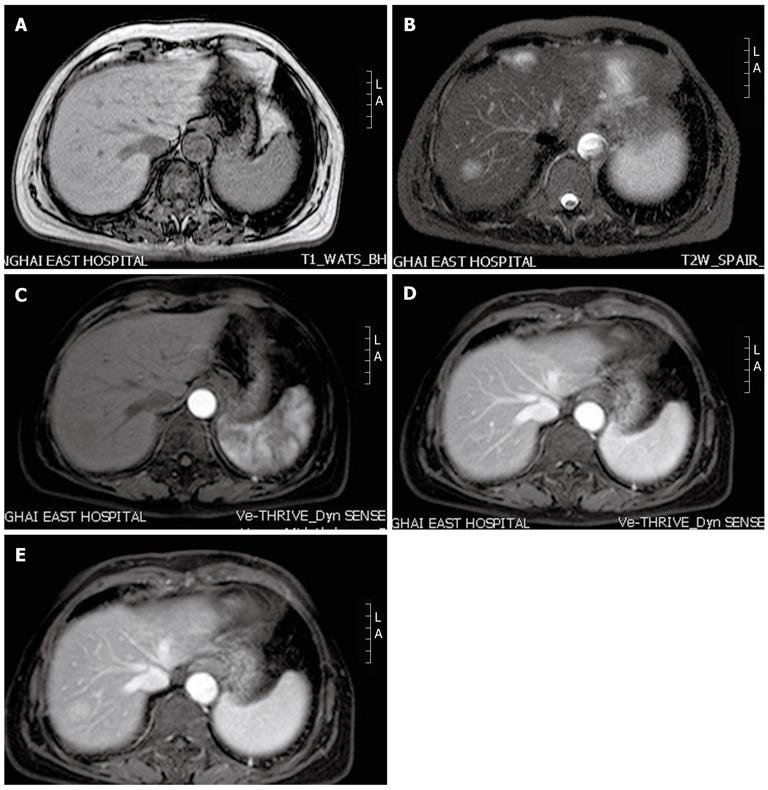
Figure 2 Magnetic resonance imaging scan findings in our patient.
A: On T1-weighted images, the hepatic lesion shows low signal intensity; B: On T2-weighted images, the lesion shows hyperintense signal intensity; C: In the arterial phase, the lesion remains unenhanced; D, E: During the portal and delayed phases, the lesion displays peripheral enhancement with a centripetal progression. L: Left; A: Ahead.
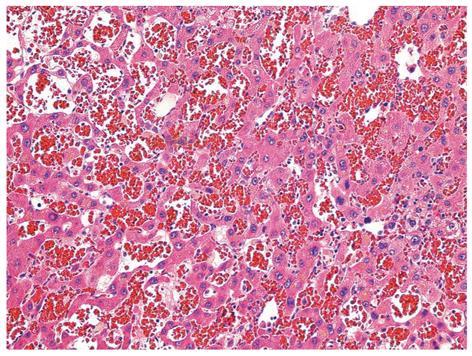
Figure 3 Photomicrograph of a liver section from our case showing variable-sized, blood-filled cystic spaces (hematoxylin and eosin, 200 ×).
- Citation: Xiong WJ, Hu LJ, Jian YC, He Y, Zhou W, Guo XL, Zheng YX. Focal peliosis hepatis in a colon cancer patient resembling metastatic liver tumor. World J Gastroenterol 2012; 18(41): 5999-6002
- URL: https://www.wjgnet.com/1007-9327/full/v18/i41/5999.htm
- DOI: https://dx.doi.org/10.3748/wjg.v18.i41.5999


