Copyright
©2012 Baishideng Publishing Group Co.
World J Gastroenterol. Nov 7, 2012; 18(41): 5925-5931
Published online Nov 7, 2012. doi: 10.3748/wjg.v18.i41.5925
Published online Nov 7, 2012. doi: 10.3748/wjg.v18.i41.5925
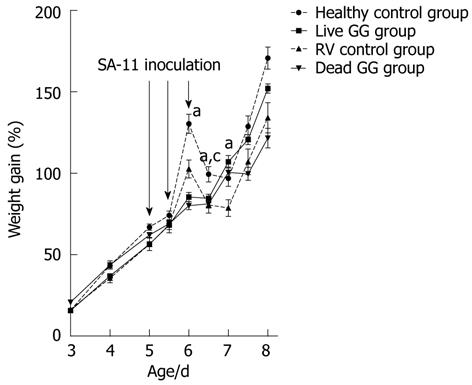
Figure 1 Percentage weight gain of the rats.
The rat pups were weighed 1-2 times daily after day 2 during the experiment. On days 5 and 6, rotavirus (RV) was inoculated orally to the rats. Weight gain is expressed as percentual weight gain from the beginning of the experiment. aP < 0.05 vs RV control group; cP < 0.05 vs dead GG group.
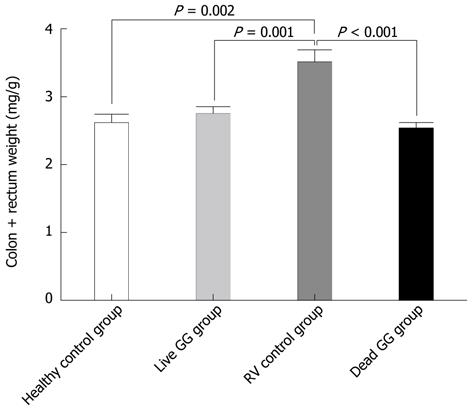
Figure 2 Weight of colon without feces.
Results between groups are presented as the weight ratio of colon/animal. P = 0.002, P = 0.001, P < 0.001 vs rotavirus (RV) control.
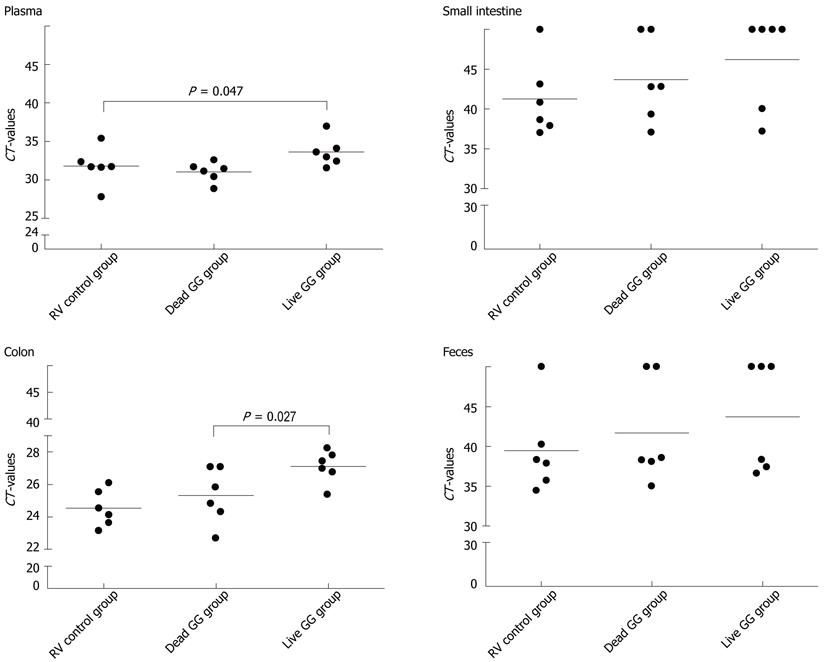
Figure 3 Rotavirus detection in plasma, small intestine, colon, and feces by real-time quantitative polymerase chain reaction.
Limit of detection of the reaction was cycle threshold (CT) 45. The lines represent the mean of the CT-values. P = 0.047 vs RV control group, P = 0.027 vs dead GG group.
-
Citation: Ventola H, Lehtoranta L, Madetoja M, Simonen-Tikka ML, Maunula L, Roivainen M, Korpela R, Holma R. Effects of the viability of
Lactobacillus rhamnosus GG on rotavirus infection in neonatal rats. World J Gastroenterol 2012; 18(41): 5925-5931 - URL: https://www.wjgnet.com/1007-9327/full/v18/i41/5925.htm
- DOI: https://dx.doi.org/10.3748/wjg.v18.i41.5925


