Copyright
©2012 Baishideng Publishing Group Co.
World J Gastroenterol. Nov 7, 2012; 18(41): 5879-5888
Published online Nov 7, 2012. doi: 10.3748/wjg.v18.i41.5879
Published online Nov 7, 2012. doi: 10.3748/wjg.v18.i41.5879
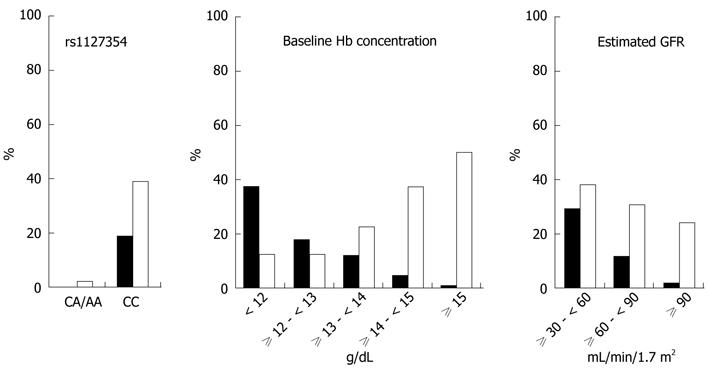
Figure 1 Anemic event rates in subset groups of each significantly independent baseline factor.
The inosine triphosphatase single nucleotide polymorphism rs1127354 genotype, baseline hemoglobin (Hb) concentration and estimated glomerular filtration rate (GFR) were significantly associated with anemic events. Black and white vertical rectangles indicate significant anemia (< 10.0 g/dL at week 4 of treatment) and significant Hb decline (> 3.0 g/dL at week 4 of treatment), respectively.
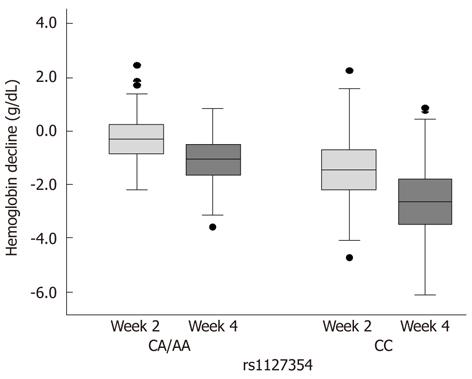
Figure 2 Hemoglobin decline from baseline at week 2 and 4 of treatment according to the inosine triphosphatase single nucleotide polymorphism rs1127354 genotypes.
Bars within boxes denote the median value of hemoglobin (Hb) decline from baseline. The boxes and the lower and upper bars represent the 25th to 75th percentiles, and the 10th and 90th percentiles, respectively. The single nucleotide polymorphism genotype significantly influenced Hb decline at week 2 and 4 (P = 5.437 × 10⁻⁹ in repeated measures analysis of variance).
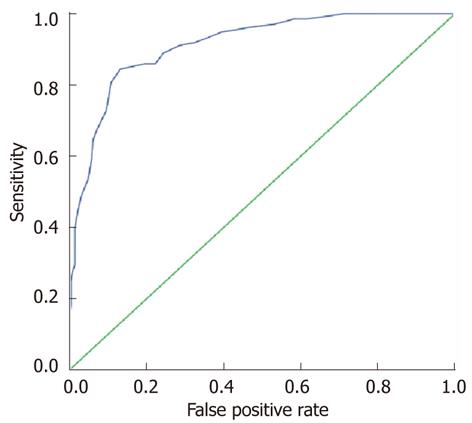
Figure 3 Receiver operating characteristic curves generated with every cut-off point of predicted probability of significant hemoglobin decline (> 3.
0 g/dL at week 4 of treatment) corresponding to each hemoglobin decline from baseline at week 2 of treatment. The area under the curve was 0.913 (95% confidence interval: 0.885-0.941, P = 4.08 × 10-43). When the sensitivity and false-positive rate were 0.844 and 0.131, the Youden’s index value of 0.713 was maximal. The optimal cut-off point of hemoglobin decline at 2 wk was 1.45 g/dL.
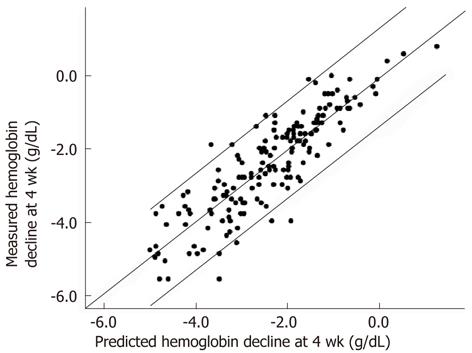
Figure 4 Correlation between predicted and measured values of hemoglobin decline at week 4 of treatment.
Predicted values were yielded by the multiple linear regression model that was constructed in the derivation group. Measured values were derived from the confirmatory group. There was a significant correlation between predicted and measured values (Spearman’s ρ = 0.880, P = 1.16 × 10-56). The area between lower and upper parallel lines of the diagonal line includes 95% of patients analyzed.
-
Citation: Tsubota A, Shimada N, Abe H, Yoshizawa K, Agata R, Yumoto Y, Ika M, Namiki Y, Nagatsuma K, Matsudaira H, Fujise K, Tada N, Aizawa Y. Several factors including
ITPA polymorphism influence ribavirin-induced anemia in chronic hepatitis C. World J Gastroenterol 2012; 18(41): 5879-5888 - URL: https://www.wjgnet.com/1007-9327/full/v18/i41/5879.htm
- DOI: https://dx.doi.org/10.3748/wjg.v18.i41.5879


