Copyright
©2012 Baishideng Publishing Group Co.
World J Gastroenterol. Oct 7, 2012; 18(37): 5225-5230
Published online Oct 7, 2012. doi: 10.3748/wjg.v18.i37.5225
Published online Oct 7, 2012. doi: 10.3748/wjg.v18.i37.5225
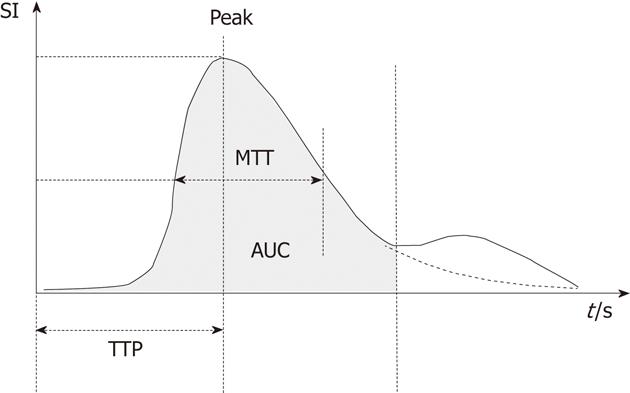
Figure 1 Main parameters extrapolated by Qontrast analysis of the time-intensity curve obtained by liver perfusion with an ultrasound contrast agent.
SI: Signal intensity; TTP: Time to peak; MTT: Mean transit time; AUC: Area under the curve.
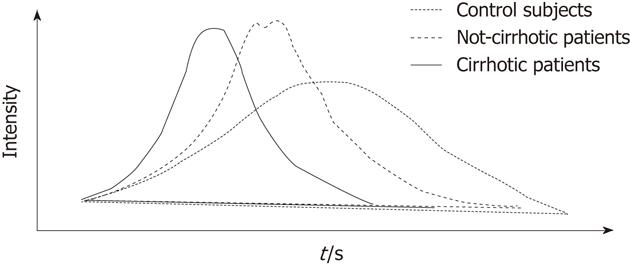
Figure 2 Schematic representation of time-intensity curves observed in the three study populations.
- Citation: Ridolfi F, Abbattista T, Busilacchi P, Brunelli E. Contrast-enhanced ultrasound evaluation of hepatic microvascular changes in liver diseases. World J Gastroenterol 2012; 18(37): 5225-5230
- URL: https://www.wjgnet.com/1007-9327/full/v18/i37/5225.htm
- DOI: https://dx.doi.org/10.3748/wjg.v18.i37.5225


