Copyright
©2012 Baishideng Publishing Group Co.
World J Gastroenterol. Sep 28, 2012; 18(36): 5021-5026
Published online Sep 28, 2012. doi: 10.3748/wjg.v18.i36.5021
Published online Sep 28, 2012. doi: 10.3748/wjg.v18.i36.5021
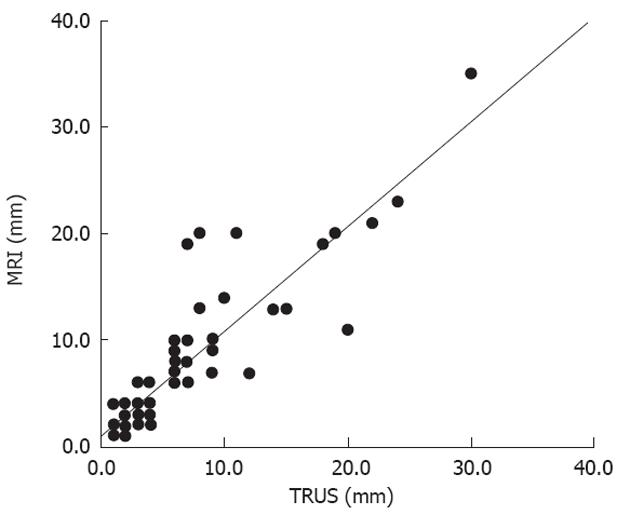
Figure 1 Plot graph showing agreement on depth of extramural tumor spread in mm.
The x-axis represents the distance measured by transrectal ultrasound (TRUS) and the magnetic resonance imaging (MRI) results are shown on the y-axis. Correlation coefficient = 0.90.
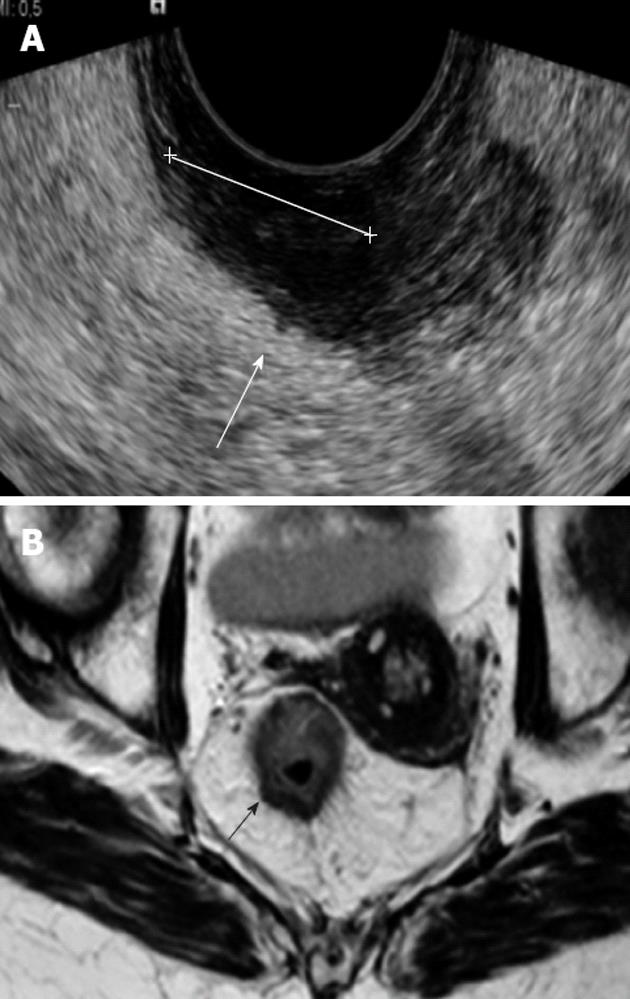
Figure 2 Early T3 rectal tumor on both transrectal ultrasound (A) and axial magnetic resonance imaging image (B).
The maximal outgrowth (arrow) was 2 mm using both methods.
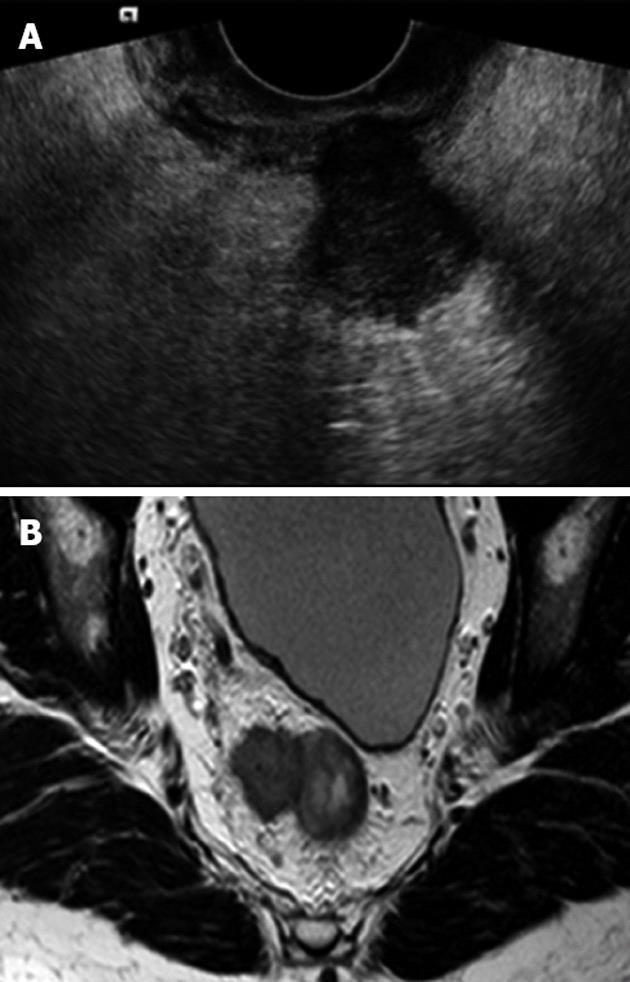
Figure 3 Transrectal ultrasound (A) and axial magnetic resonance imaging images (B) of a patient showing an advanced T3 rectal tumor.
The maximal outgrowth on the right side measures 20 mm equally on transrectal ultrasound and axial magnetic resonance imaging.
- Citation: Rafaelsen SR, Vagn-Hansen C, Sørensen T, Pløen J, Jakobsen A. Transrectal ultrasound and magnetic resonance imaging measurement of extramural tumor spread in rectal cancer. World J Gastroenterol 2012; 18(36): 5021-5026
- URL: https://www.wjgnet.com/1007-9327/full/v18/i36/5021.htm
- DOI: https://dx.doi.org/10.3748/wjg.v18.i36.5021


