Copyright
©2012 Baishideng Publishing Group Co.
World J Gastroenterol. Sep 14, 2012; 18(34): 4704-4713
Published online Sep 14, 2012. doi: 10.3748/wjg.v18.i34.4704
Published online Sep 14, 2012. doi: 10.3748/wjg.v18.i34.4704
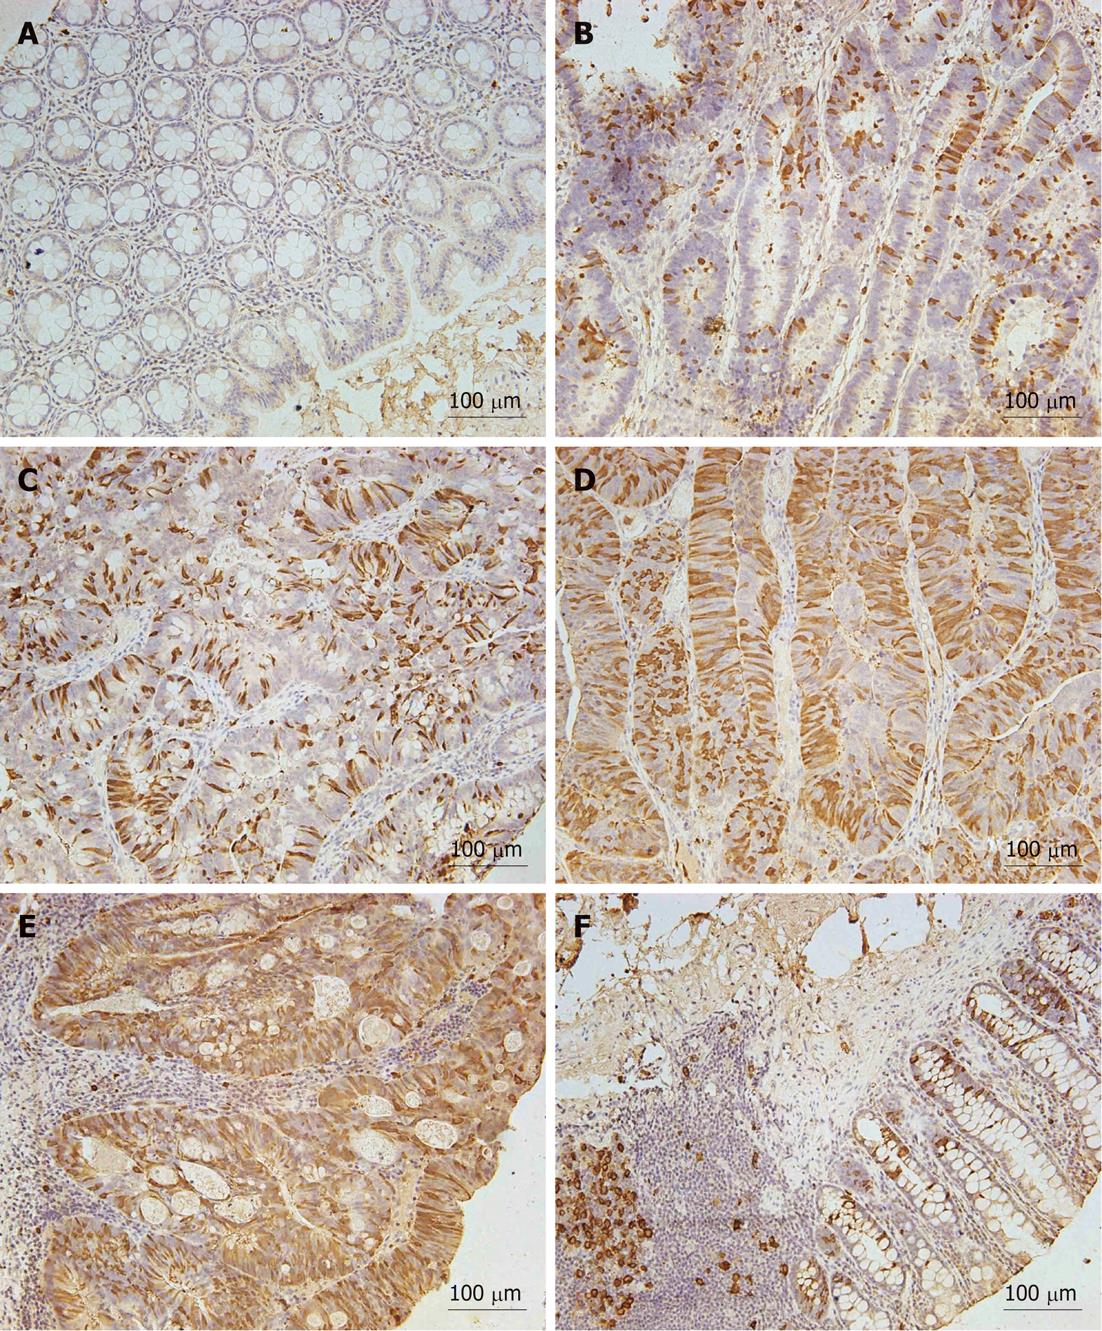
Figure 1 Immunohistochemical analysis of ribonucleotide reductase M2 expression in surgical specimens of tumor tissues or adjacent normal mucosa from patients with colon cancer.
A: Normal colorectal mucosa without ribonucleotide reductase M2 (RRM2) expression. This case was considered RRM2-negative; B: Lower RRM2 expression in colorectal cancer (CRC); C-E: High RRM2 expression in CRC; F: Lymph node metastasis of CRC with RRM2 overexpression (original magnification × 20).
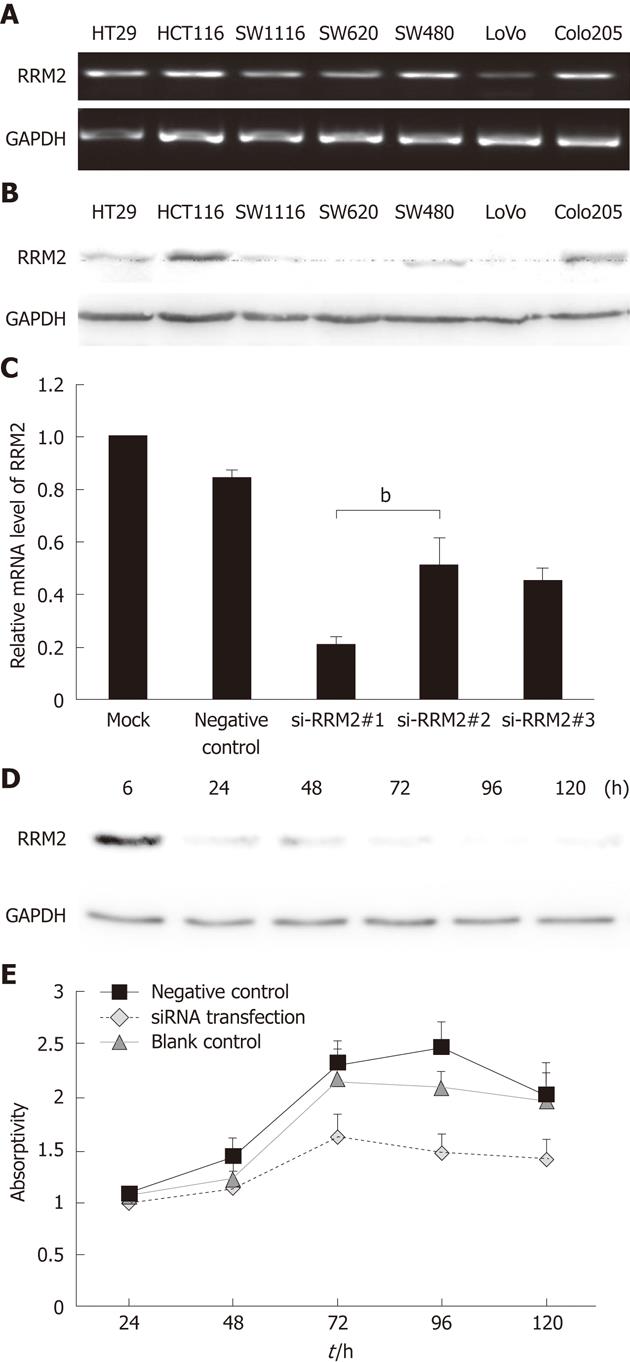
Figure 2 Expression of ribonucleotide reductase M2 in colorectal carcinoma cell lines and effect of ribonucleotide reductase M2 depletion on cell proliferation.
A: Ribonucleotide reductase M2 (RRM2) expression in seven colorectal cancer (CRC) cell lines (PCR analysis); B: Expression of RRM2 protein in seven CRC cell lines (Western blotting); C: 48 h after siRNA transfection, relative mRNA level of HCT116 was determined (mock: lipofectamine only, negative control: lipofectamine + control siRNA), bP < 0.01 si-RRM2#1 vs si-RRM2#2; D: HCT116 cells were transfected with si-RRM2#1 and cultured for 120 h. Cells were lysed and RRM2 protein levels were detected by Western blotting. Glyceraldehyde 3-phosphate dehydrogenase expression was used to control equal protein loading; E: At 24-120 h after siRNA transfection, the viability of HCT116 cells was determined by the CCK-8 assay. Analysis of cell growth in the presence or absence of RRM2 siRNAs revealed that blocking RRM2 protein synthesis significantly inhibited HCT116 cell growth. GAPDH: Glyceraldehyde 3-phosphate dehydrogenase.
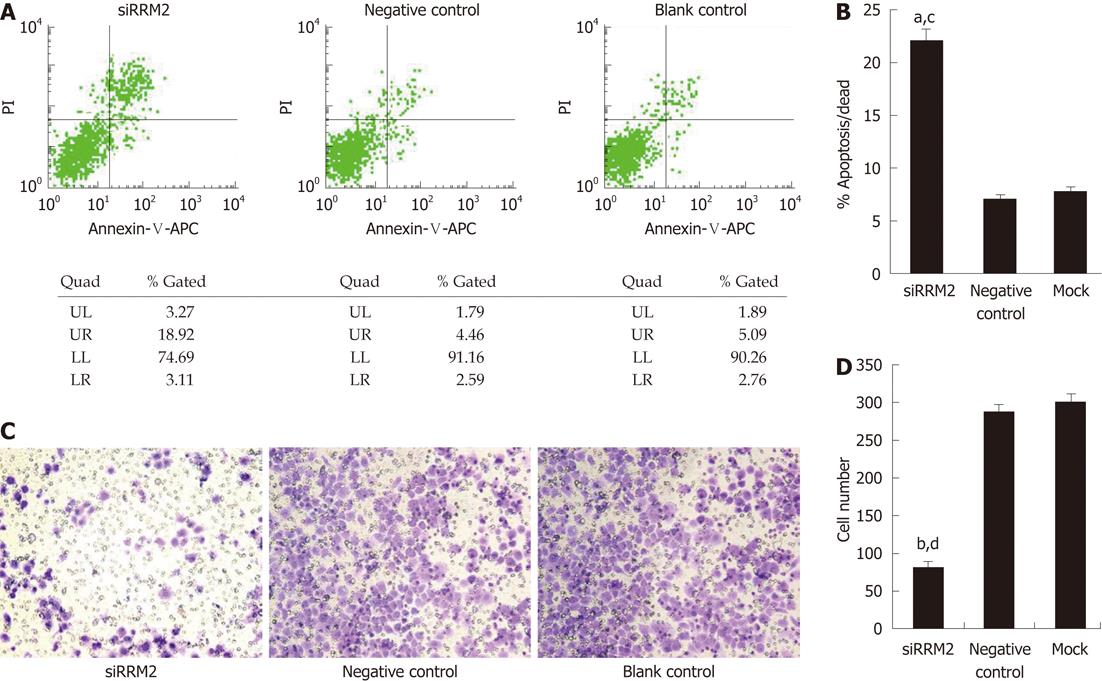
Figure 3 Effect of ribonucleotide reductase M2 on apoptosis and invasive capacity.
A: Increased apoptosis following ribonucleotide reductase M2 (RRM2) mRNA inhibition by RNAi. Percentages of cells in the bottom left quadrant are live while cells to the right of the vertical line are apoptotic or dead; B: Quantifying bar graphs showing a significant increase in the percentage of apoptotic/dead cells following RRM2 mRNA knockdown with siRNA, aP < 0.05 vs negative control; cP < 0.05 vs blank control; C: Effect of RRM2 on invasive capacity of colorectal cancer cells. Invasion through the Matrigel-coated collagen insert after the indicated treatments is shown; D: Quantifying bar graphs showing a significant decrease in cell number following RRM2 mRNA knockdown with siRNA, bP < 0.01 vs negative control; dP < 0.01 vs blank control. Quad: Quadrant; UL: Upper left; UR: Upper right; LL: Lower left; LR: Lower right. PI: Propidium iodide.
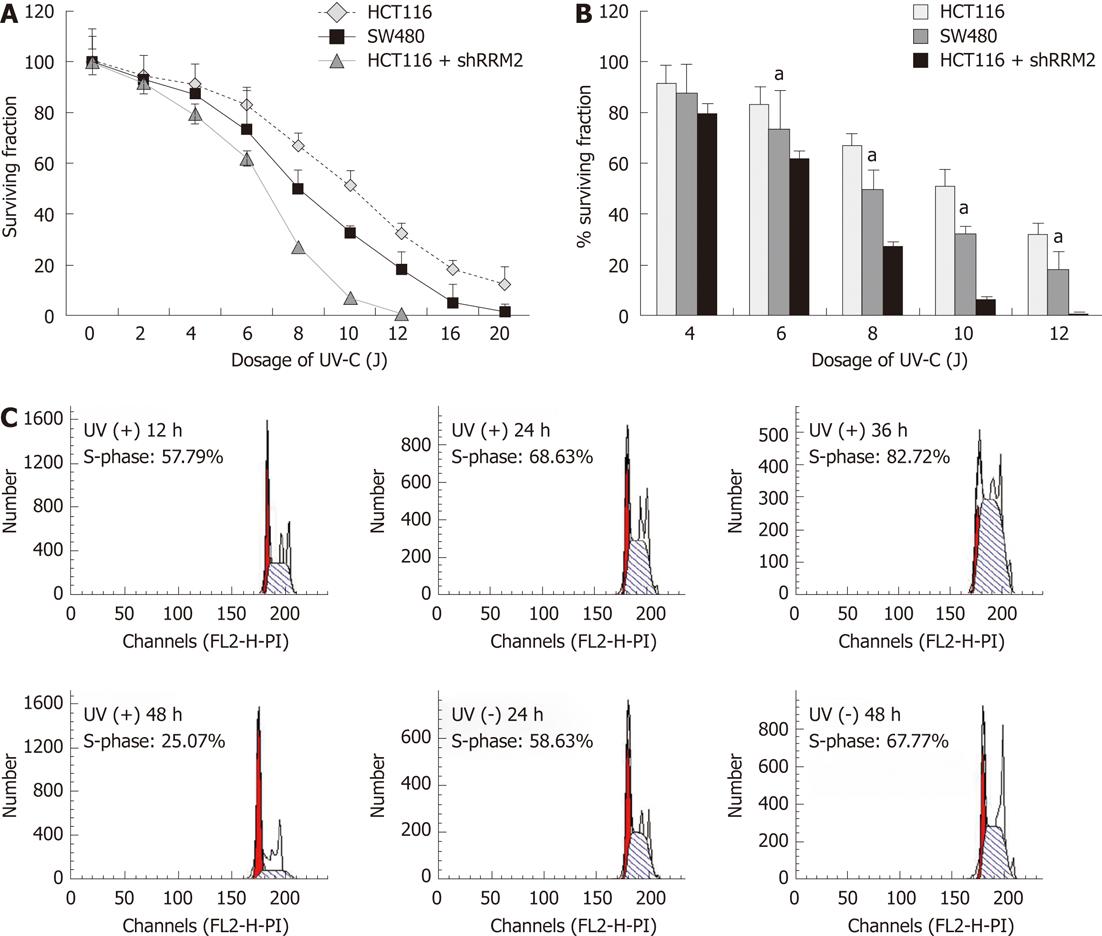
Figure 4 Inhibition of ribonucleotide reductase M2 by expression of antisense hRRM2 results in increased ultraviolet sensitivity of colorectal cancer cells.
A: Ribonucleotide reductase M2 (RRM2)-/- tumors and RRM2-depleted cells are hypersensitive to ultraviolet (UV)-C. SW620 cells, HCT116 cells (WT), and HCT116 cells (RRM2-/-) were irradiated with increasing doses of UV-C and assayed for colony formation; B: Bar graph showing the quantification of the surviving fraction following 4-12 J irradiation. HCT116 cells transfected with shRRM2 revealed significant RRM2 depletion, and its colony-forming ability under UV radiation was suppressed, aP < 0.05 vs HCT116 group; C: Effects of colorectal cancer cell cycle irradiated with UV-C. After UV irradiation, an S-phase increase could be seen, starting from 12 h with a continued significant increase at 24 and 36 h.
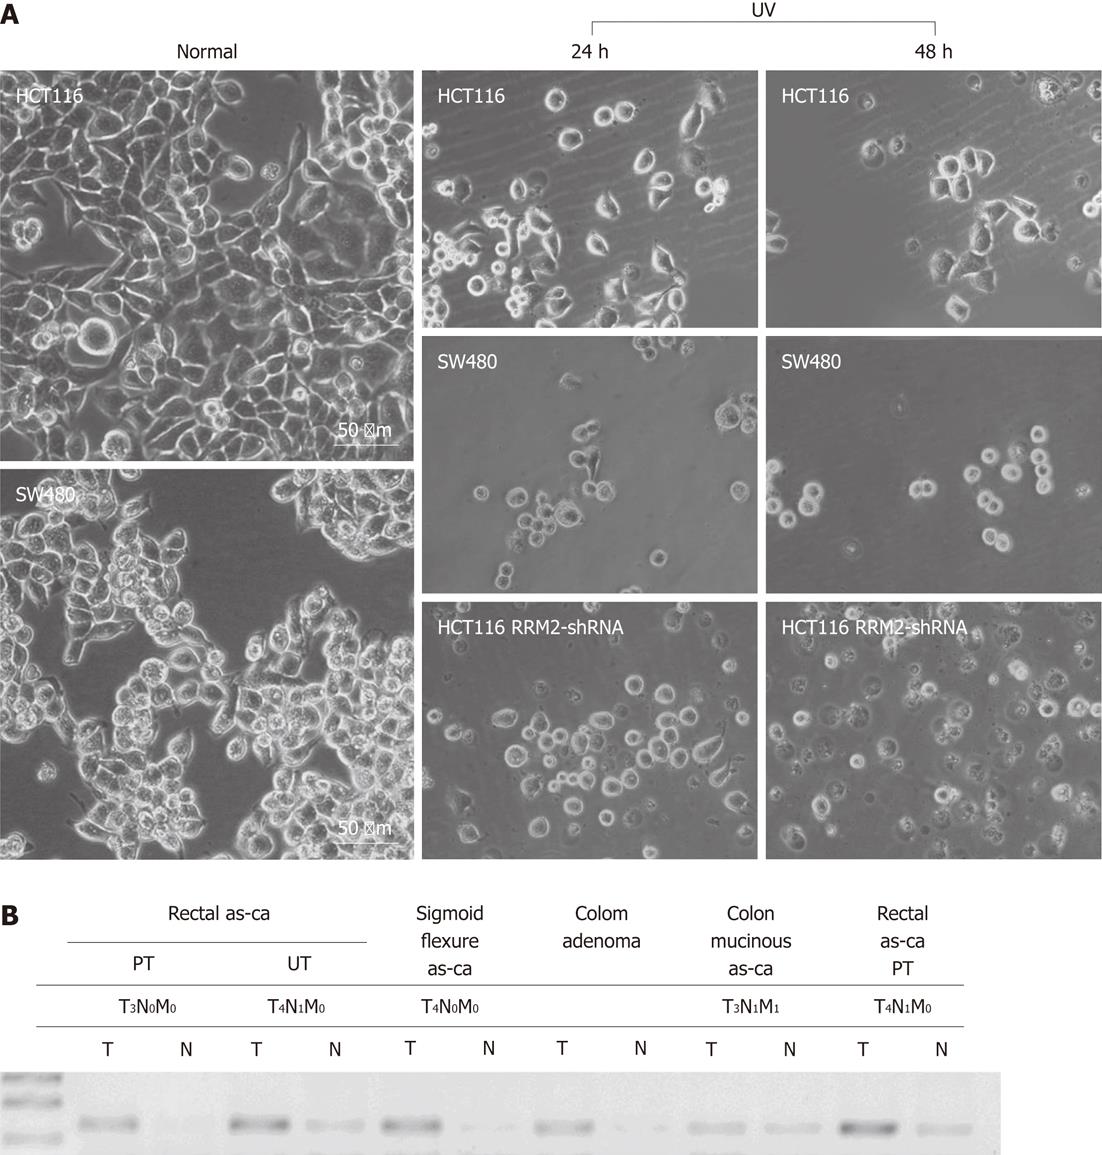
Figure 5 Light-microscopic photograph of cellular morphology.
A: After 48 h of culture in normal conditions or exposed to ultraviolet (UV), HCT116 cells [high expression level of ribonucleotide reductase M2 (RRM2)] and SW480 cells (low expression level of RRM2) were photographed (20 × magnification). With UV-C irradiating, SW480 cells formed spheroids and HCT116 cells still adhered to each other and attached; B: Expression of RRM2 mRNA in clinical tissue specimens. Polymerase chain reaction analyses of 25 colorectal cancer patients (we show 6 patients) showed the expression levels of RRM2. PT: Protrude type; UT: Ulcerative type; as-ca: Adenocarcinoma.
- Citation: Lu AG, Feng H, Wang PXZ, Han DP, Chen XH, Zheng MH. Emerging roles of the ribonucleotide reductase M2 in colorectal cancer and ultraviolet-induced DNA damage repair. World J Gastroenterol 2012; 18(34): 4704-4713
- URL: https://www.wjgnet.com/1007-9327/full/v18/i34/4704.htm
- DOI: https://dx.doi.org/10.3748/wjg.v18.i34.4704


