Copyright
©2012 Baishideng Publishing Group Co.
World J Gastroenterol. Aug 28, 2012; 18(32): 4427-4434
Published online Aug 28, 2012. doi: 10.3748/wjg.v18.i32.4427
Published online Aug 28, 2012. doi: 10.3748/wjg.v18.i32.4427
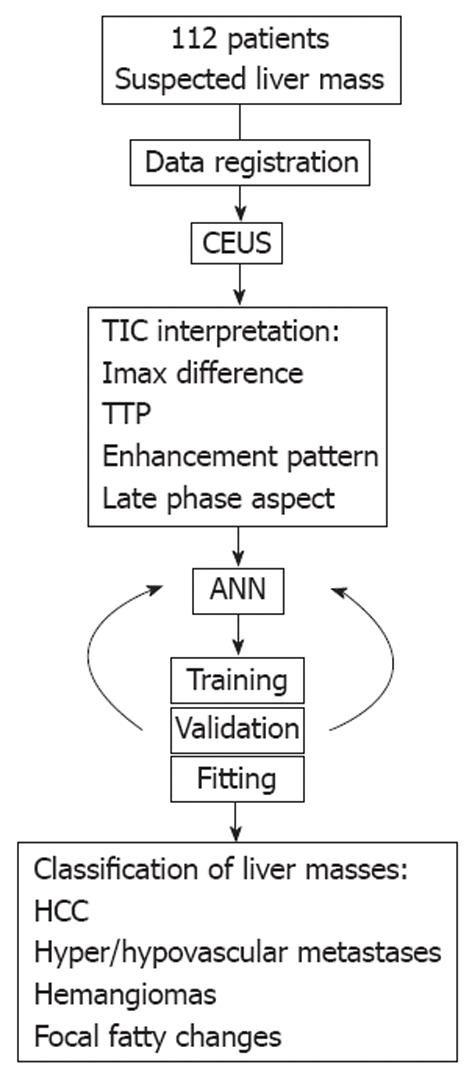
Figure 1 Study protocol.
The patients were registered and contrast-enhanced ultrasonography (CEUS) was performed, with subsequent movie registration and offline time-intensity curve (TIC) analysis. Relevant parameters were fed to the artificial neural networks (ANN) which divided the dataset into training, validation and fitting lots. A back propagation and 10-fold cross-validation algorithm assured a high accuracy for the classifications obtained by the ANN system. Imax: Maximum intensities; TTP: Time to reaching peak intensities; HCC: Hepatocellular carcinoma.
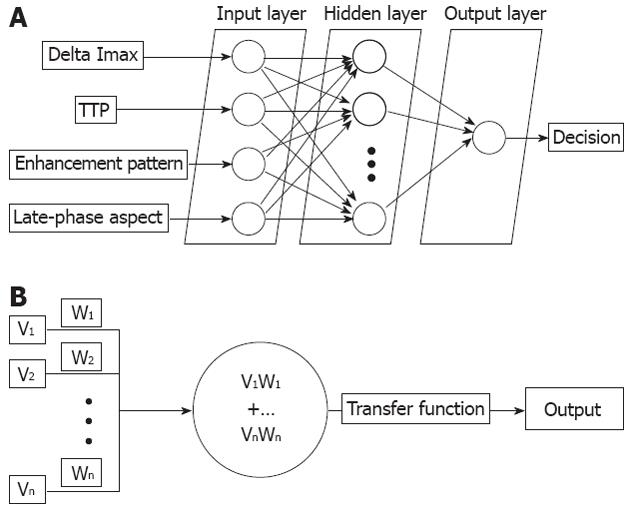
Figure 2 Graphical representation of an artificial neural networks and a neuron from the 2nd hidden layer.
A: The four classes of parameters are imputed to corresponding neurons in the first layer of the artificial neural networks, which in turn establish synaptic connections with all neurons of the 2nd hidden layer. These neurons provide a value for the output layer, which in turn presents the user with a classification decision; B: Neurons in the hidden layer receive multiple inputs (V) which are attributed specific weights (W) and all products between these two values are summed. The corresponding result (output) is forwarded through a transfer function of the efferent synapse. Imax: Maximum intensities; TTP: Time to reaching peak intensities.
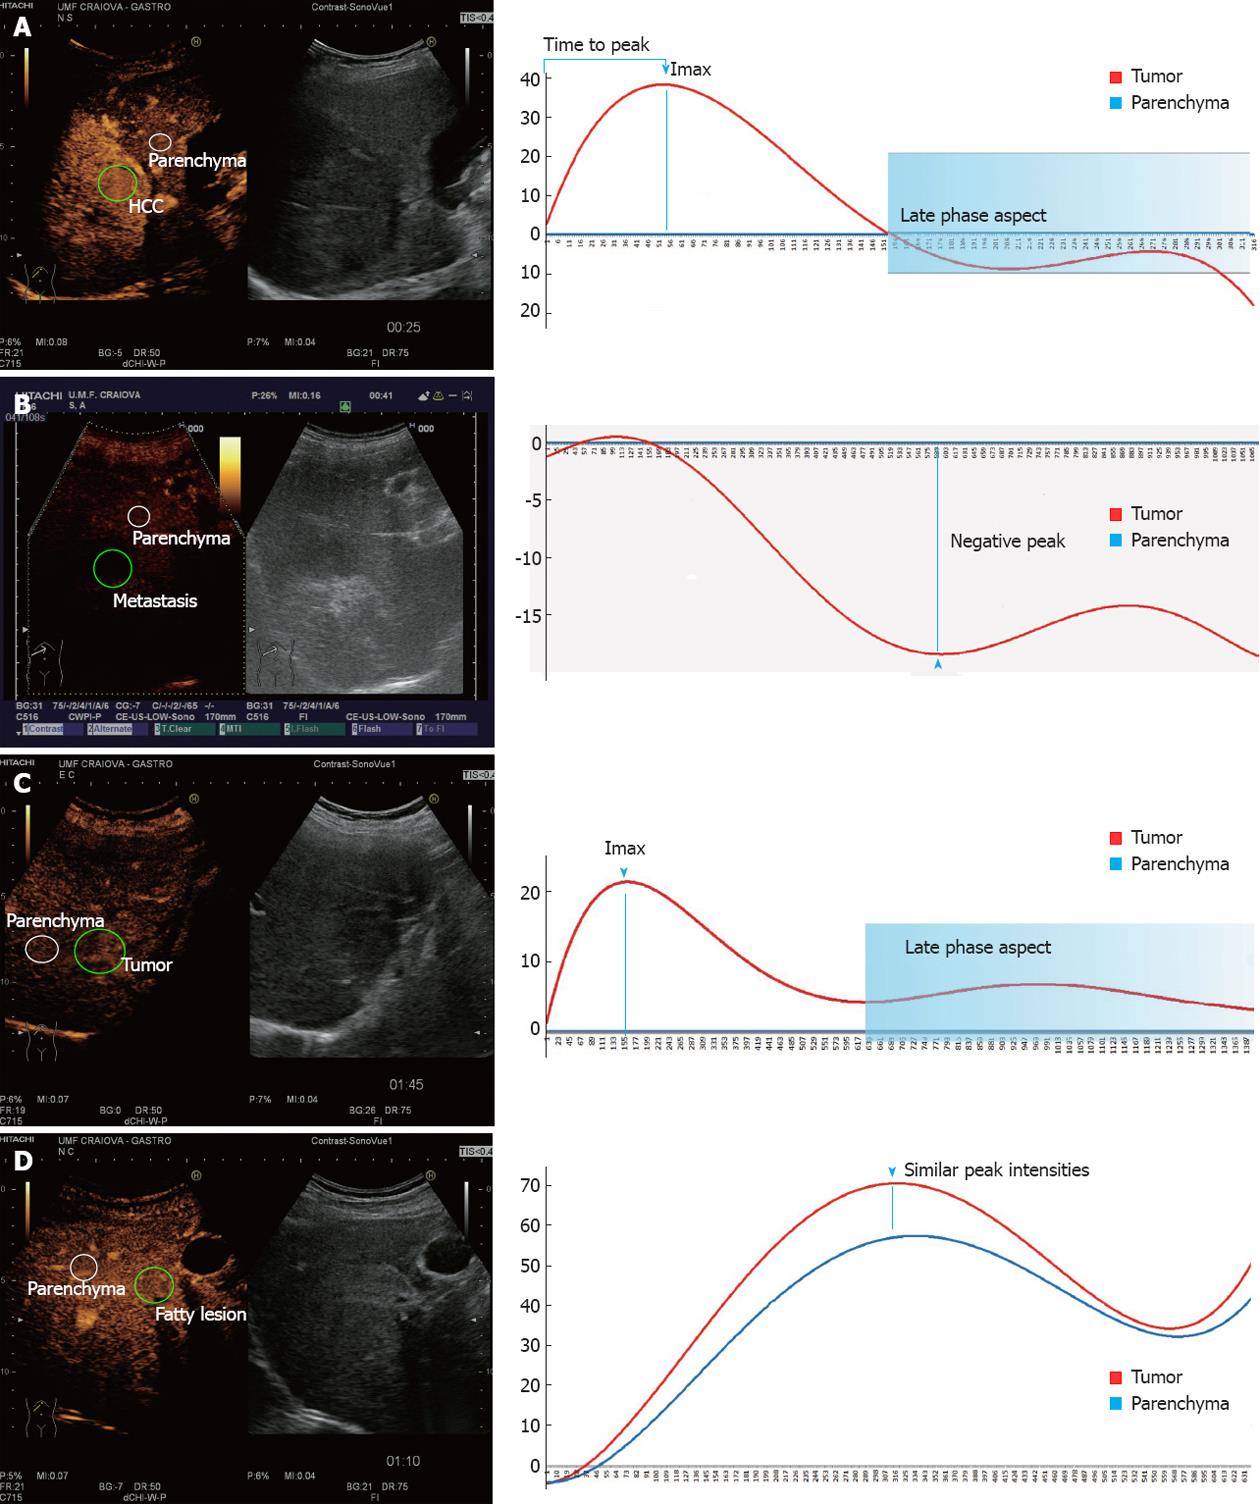
Figure 3 Examples of contrast-enhanced ultrasonography aspects and the selection of the two regions of interest, corresponding to the liver tumor and normal parenchyma, respectively.
Graphical representation of the time-intensity curve (TIC) and the most important parameters extracted and later fed to the artificial neural networks. A: Hepatocellular carcinoma (HCC)-positive contrast uptake in the early arterial phase followed by wash-out in the portal/late phase; B: Hypovascular metastasis-hypoenhancement of the tumor compared to normal parenchyma; C: Hepatic hemangyoma-absence of the wash-out and positive peak intensity; D: Focal fatty change-similar TIC parameters for the two selected areas of interest.
- Citation: Streba CT, Ionescu M, Gheonea DI, Sandulescu L, Ciurea T, Saftoiu A, Vere CC, Rogoveanu I. Contrast-enhanced ultrasonography parameters in neural network diagnosis of liver tumors. World J Gastroenterol 2012; 18(32): 4427-4434
- URL: https://www.wjgnet.com/1007-9327/full/v18/i32/4427.htm
- DOI: https://dx.doi.org/10.3748/wjg.v18.i32.4427


