Copyright
©2012 Baishideng Publishing Group Co.
World J Gastroenterol. Aug 28, 2012; 18(32): 4404-4411
Published online Aug 28, 2012. doi: 10.3748/wjg.v18.i32.4404
Published online Aug 28, 2012. doi: 10.3748/wjg.v18.i32.4404
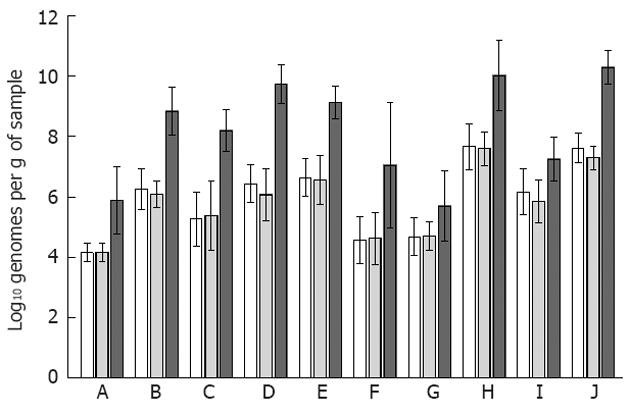
Figure 1 Quantities of bacterial groups detected on the mucosa and in faeces.
The bacterial targets A: Akkermansia muciniphila; B: Bacteroidetes; C: Bifidobacterium spp.; D: Clostridium cluster IV; E: Clostridium cluster XIVab; F: Collinsella aerofaciens; G: Enterobacteriaceae; H: Faecalibacterium prausnitzii; I: Veillonella spp.; J: Eubacteria are represented with the three sample types side-by-side (biopsies from the right colon as white bars with pattern; biopsies from the left colon as grey bars; faecal samples with dark grey bars). The bacterial quantities between the two mucosal samples did not differ according to paired t-tests, whereas the faecal quantities of all analysed bacteria were significantly higher than those detected for either mucosal site (P < 0.05), except for Enterobacteriaceae. The error bars denote the 95% CI.
- Citation: Lyra A, Forssten S, Rolny P, Wettergren Y, Lahtinen SJ, Salli K, Cedgård L, Odin E, Gustavsson B, Ouwehand AC. Comparison of bacterial quantities in left and right colon biopsies and faeces. World J Gastroenterol 2012; 18(32): 4404-4411
- URL: https://www.wjgnet.com/1007-9327/full/v18/i32/4404.htm
- DOI: https://dx.doi.org/10.3748/wjg.v18.i32.4404


