Copyright
©2012 Baishideng Publishing Group Co.
World J Gastroenterol. Aug 28, 2012; 18(32): 4278-4287
Published online Aug 28, 2012. doi: 10.3748/wjg.v18.i32.4278
Published online Aug 28, 2012. doi: 10.3748/wjg.v18.i32.4278
Figure 1 Steps of the surgical procedure.
A: Isolation of the distal colon exposing the vascular arcade; B: Section of distal colon; C: Confection of colostomy; D: Completion of colostomy.
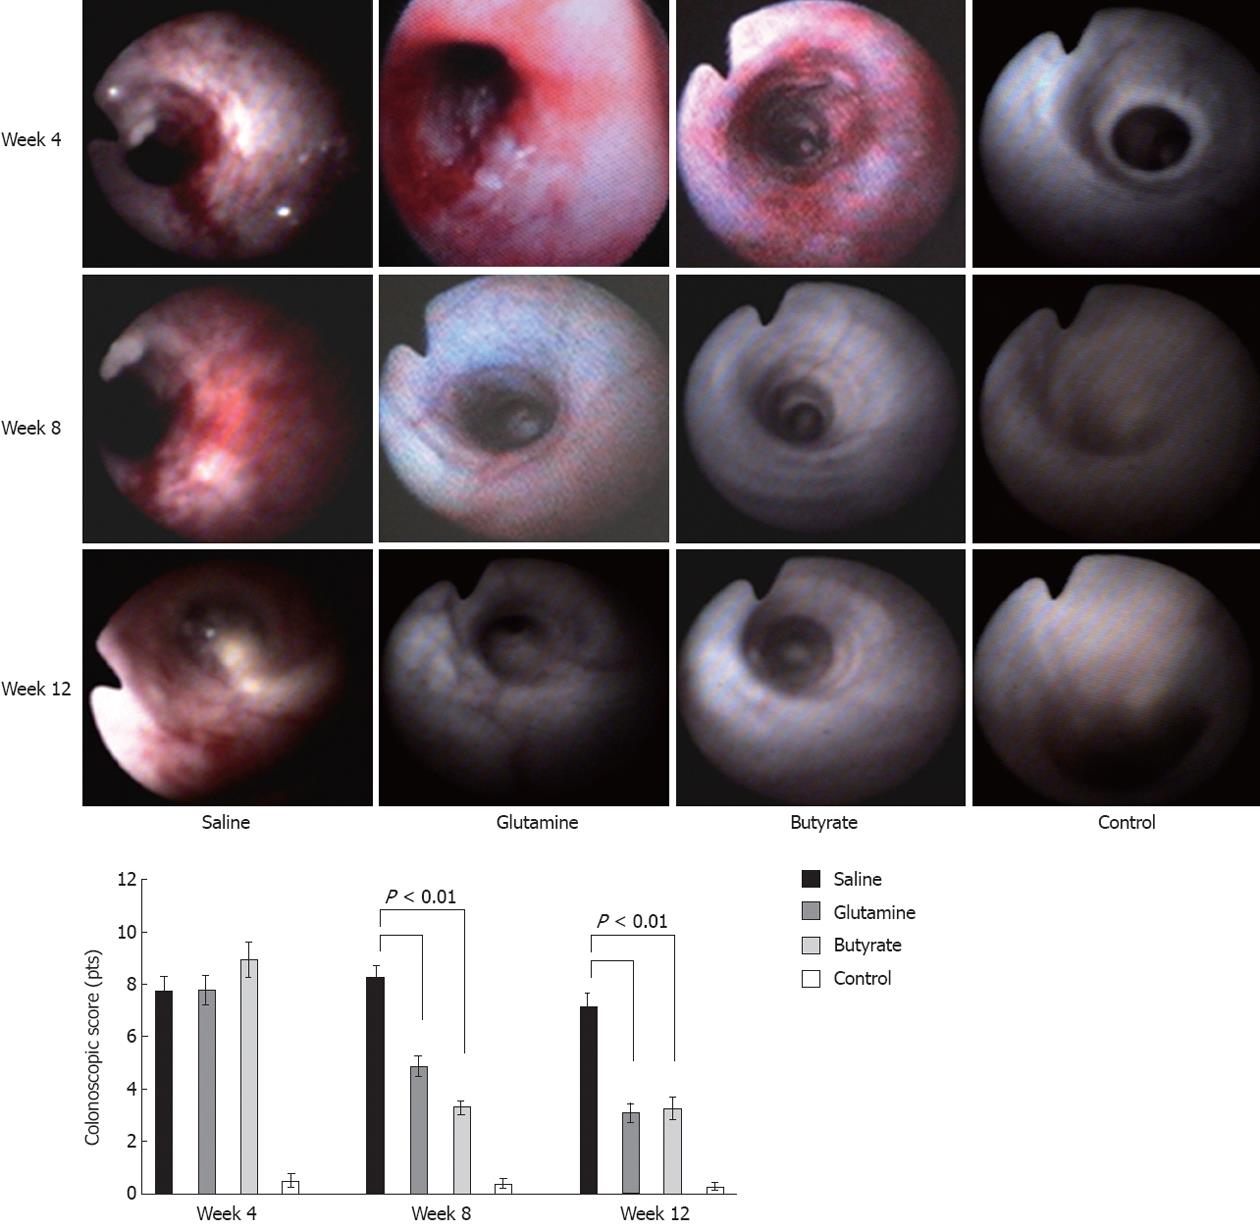
Figure 2 Endoscopic images of the diverted segments of the colon treated with different protocols at 4 wk, before treatment, and at 8 wk, the peak of inflammation in this experimental model.
Diversion colitis is characterized by the presence of a fragile mucosa, hyperemia, spontaneous bleeding, and increased number of vessels and mucous secretion (at 8 wk). Colonoscopic images were semi-quantitatively analyzed with an endoscopic score. Animals treated with either glutamine or butyrate showed significantly reduced colonoscopic scores compared to animals without any treatment at 8 and 12 wk. Significant differences are noted (n = 6 in each group).
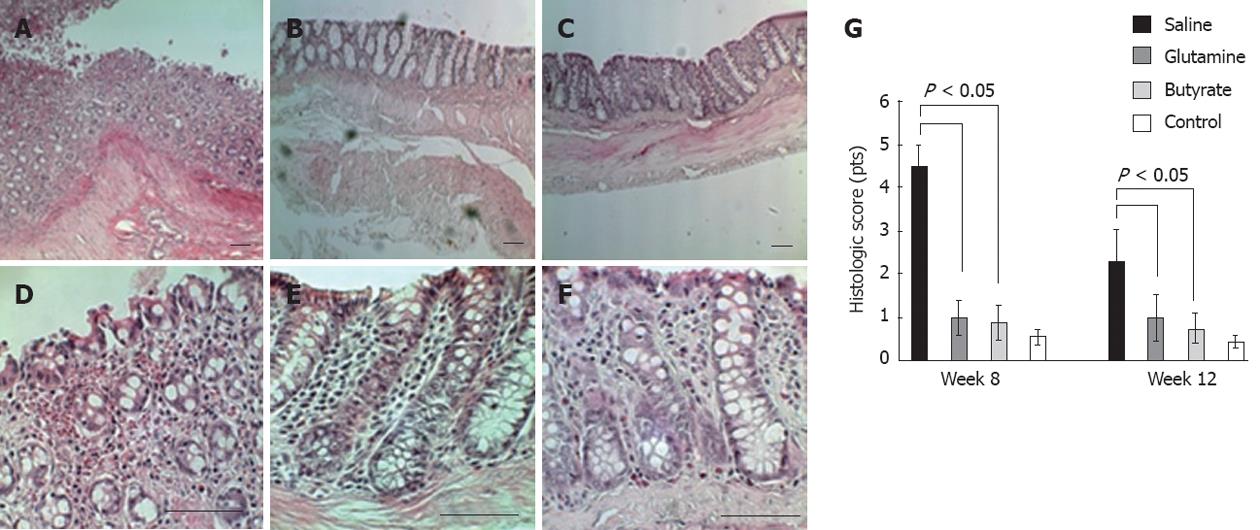
Figure 3 Hematoxylin-eosin-stained slides of diverted colon samples obtained at 8 wk.
A, B: Images were captured at ×100 and ×400 magnifications, respectively. Diversion colitis is characterized by a predominantly mononuclear cell infiltration, hyperemia, vasodilatation, and associated atrophic changes; C, D: Glutamine-treated animals show a slightly inflamed colon; E, F: Butyrate-treated animals show an almost normal colon (n = 6 in each group). Bars represent 50 μm.
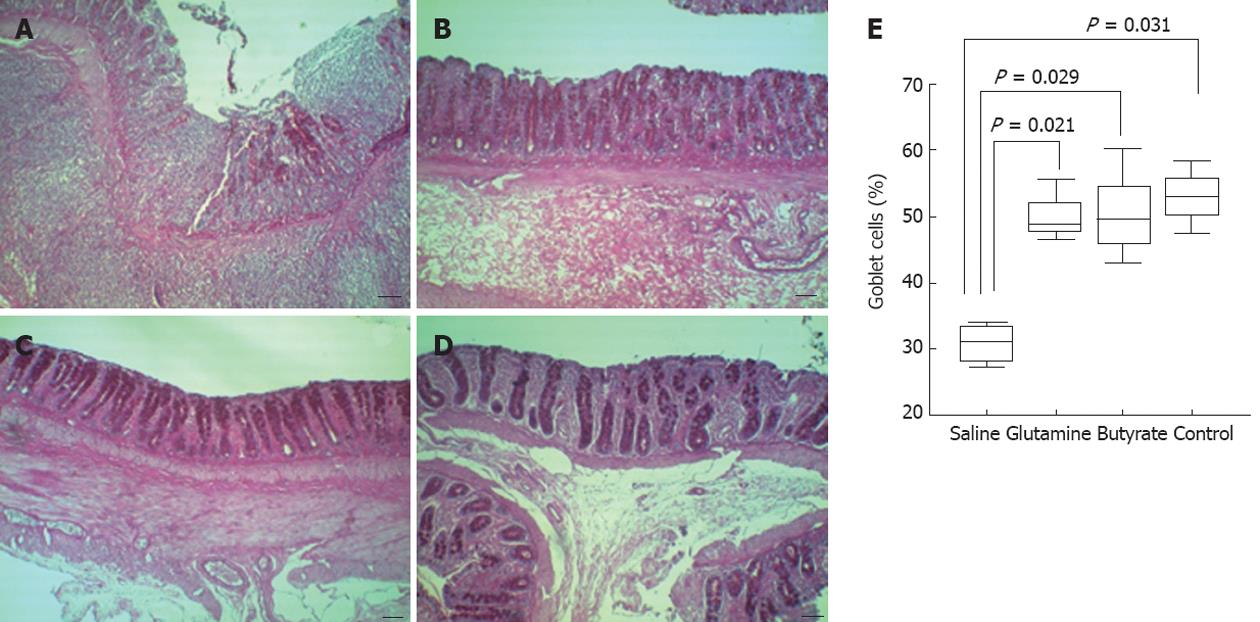
Figure 4 Quantitative analysis of goblet cells using periodic acid-schiff-stained slides of diverted colon samples obtained at 8 wk.
Images show a significant reduction in the number of goblet cells in slides from animals with placebo-treated (A) colitis compared to (B) glutamine-treated, butyrate-treated(C) and control animals (D). Images were captured at ×100 magnification. In the slides, bars represent 50 μm. In the graph (E), horizontal bars represent medians, boxes represent the 25th and 75th percentiles, and vertical bars represent ranges. Significant differences are noted (n = 6 in each group).
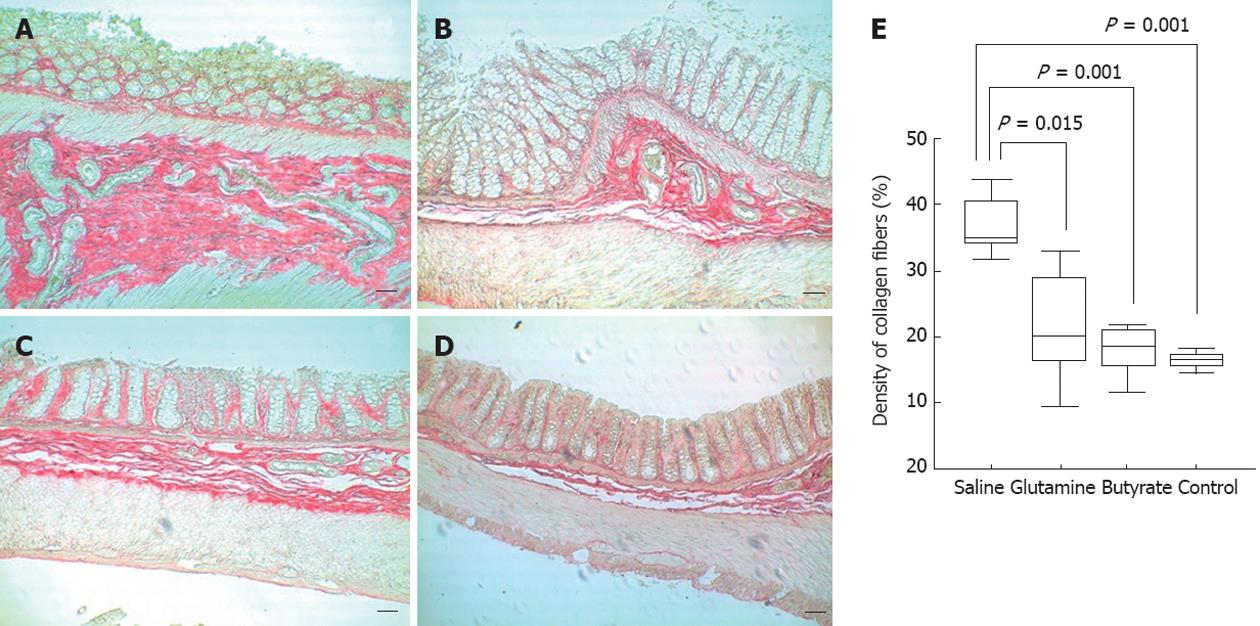
Figure 5 Quantitative analysis of collagen fiber deposition in picric acid-stained slidesand apoptotic terminal deoxynucleotidyl transferase dUTP nick end labeling-positive cells of diverted colon samples obtained at 8 wk.
Images show a significant increase of collagen density in slides from animals with placebo-treated (A) colitis compared to (B) glutamine-treated, butyrate-treated (C) and control animals (D). Images were captured at ×100 magnification. In the slides, bars represent 50 μm. In the graph (E), horizontal bars represent medians, boxes represent the 25th and 75th percentiles, and vertical bars represent ranges. Significant differences are noted (n = 6 in each group).
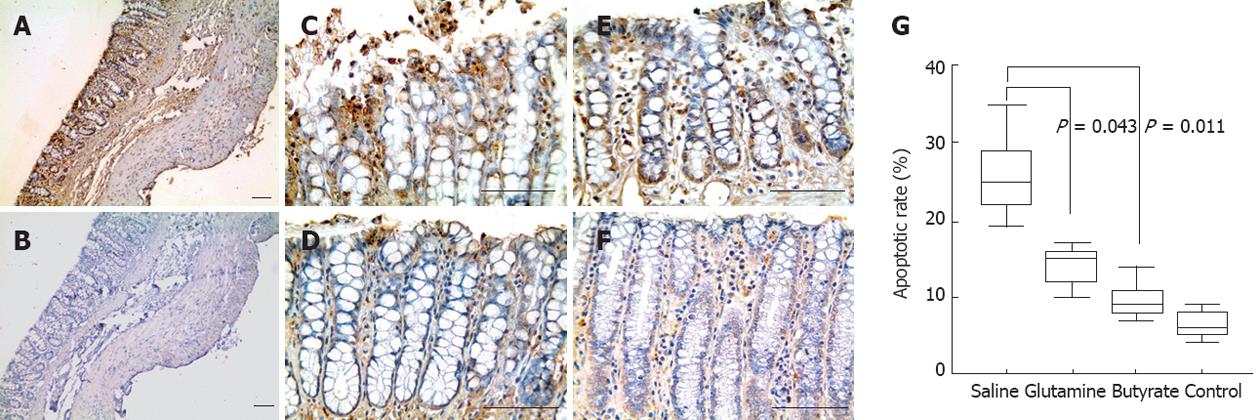
Figure 6 Quantitative analysis of apoptotic terminal deoxynucleotidyl transferase dUTP nick end labeling-positive cells of diverted colon samples obtained at 8 wk.
Images show a significant reduction in the number of apoptotic cells in slides from animals with placebo-treated (A) colitis compared to (B) glutamine-treated, butyrate-treated (C) and control animals (D). Images were captured at ×100 magnification. In the slides, bars represent 50 μm. In the graph (G), horizontal bars represent medians, boxes represent the 25th and 75th percentiles, and vertical bars represent ranges. Significant differences are noted (n = 6 in each group).
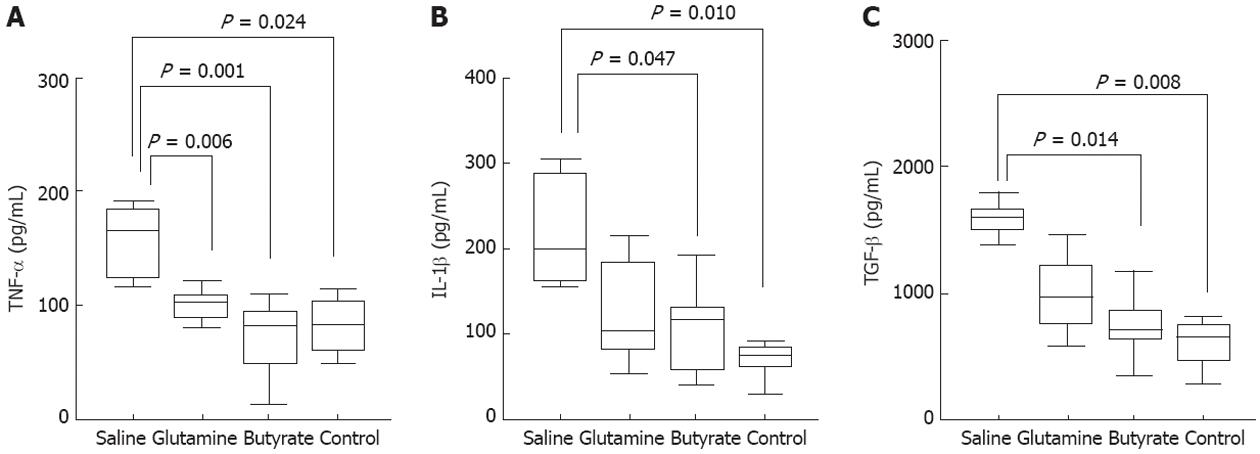
Figure 7 Cytokine production by the colonic mucosa of the diverted segment, obtained at 8 wk.
Cytokines in 24 h organ cultures were measured by enzyme-linked immunosorbent assay and presented in pg/mL of culture supernatant, normalized to the protein content of tissues. A: High levels of tumor necrosis factor-α (TNF-α) measured in saline-treated colitis were restored to normal values following treatment with glutamine or butyrate; B, C: The high levels of interleukin (IL)-1β and of transforming growth factor beta (TGF-β) detected in supernatants of saline-treated colitis decreased significantly after treatment with butyrate. Horizontal bars represent medians, boxes represent the 25th and 75th percentiles, and vertical bars represent ranges. Significant differences are noted (n = 6 in each group).
- Citation: Pacheco RG, Esposito CC, Müller LC, Castelo-Branco MT, Quintella LP, Chagas VLA, de Souza HSP, Schanaider A. Use of butyrate or glutamine in enema solution reduces inflammation and fibrosis in experimental diversion colitis. World J Gastroenterol 2012; 18(32): 4278-4287
- URL: https://www.wjgnet.com/1007-9327/full/v18/i32/4278.htm
- DOI: https://dx.doi.org/10.3748/wjg.v18.i32.4278


