Copyright
©2012 Baishideng Publishing Group Co.
World J Gastroenterol. Aug 7, 2012; 18(29): 3910-3916
Published online Aug 7, 2012. doi: 10.3748/wjg.v18.i29.3910
Published online Aug 7, 2012. doi: 10.3748/wjg.v18.i29.3910
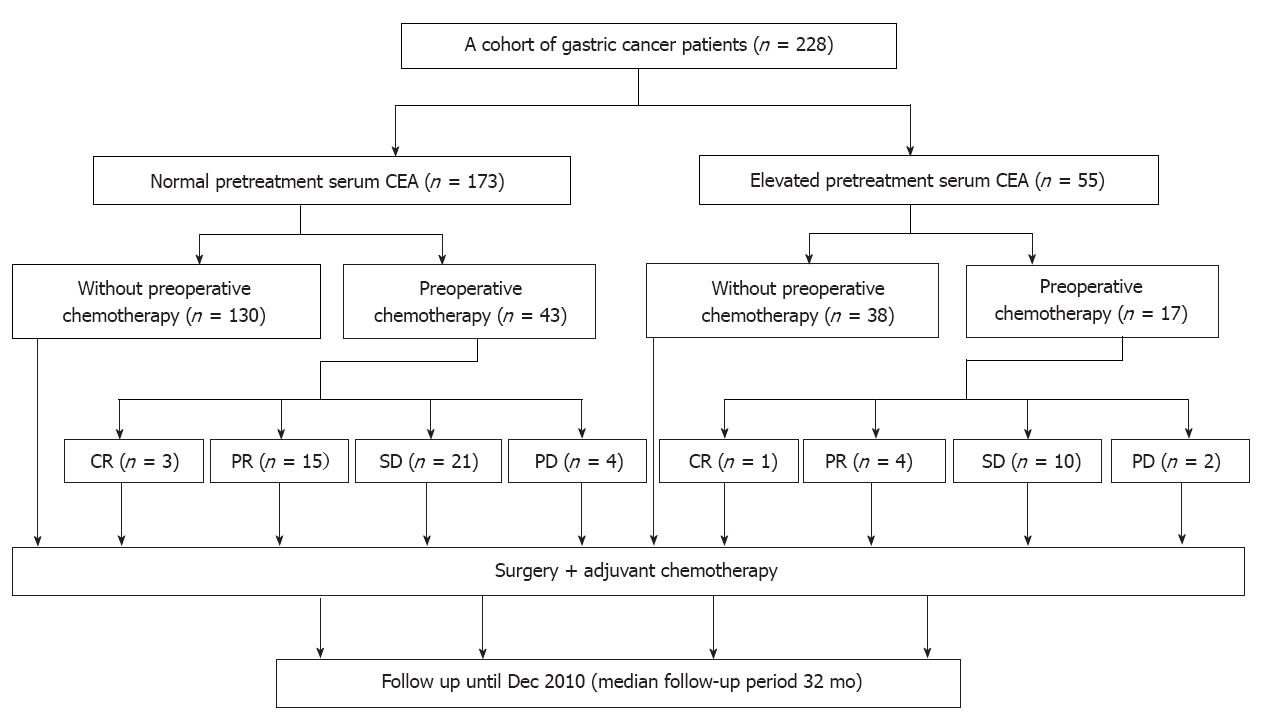
Figure 1 The treatment subgroups of the cohort of 228 patients in this retrospective study.
CEA: Carcinoembryonic antigen; CR: Complete response; PR: Partial response; SD: Stable disease; PD: Progressive disease.
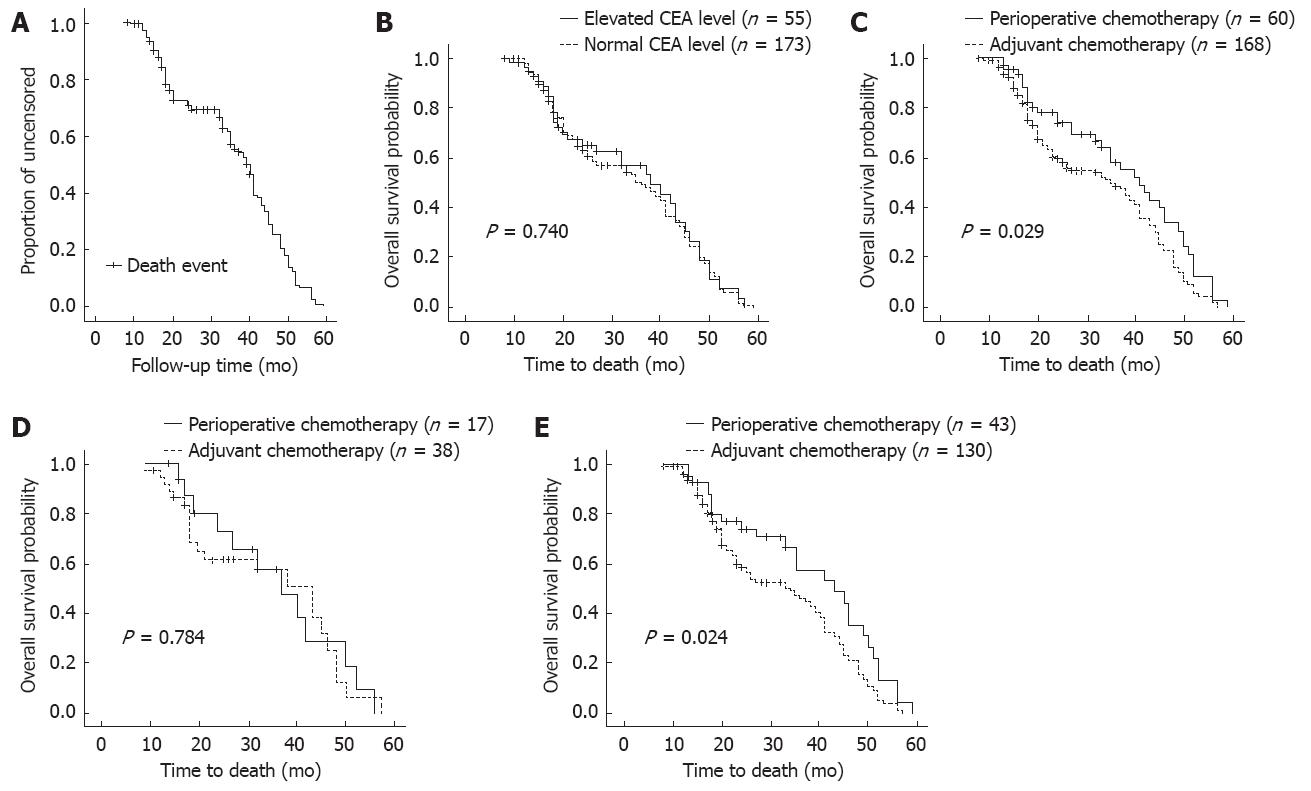
Figure 2 Survival curves for carcinoembryonic antigen patients with different treatments.
A: The 228 patients in follow-up over this study; follow-up times ranged from 8 to 59 mo (median, 32 mo); B: Survival curves for the elevated carcinoembryonic antigen (CEA) patients and the normal CEA patients, with two-year survival rates of 57% and 51%, respectively, and no statistically significant difference between the groups (P = 0.740); C: Survival curves for patients receiving perioperative chemotherapy or adjuvant chemotherapy, with two-year survival rates of 58% and 50%, respectively. The difference is statistically significant (P = 0.029); D: Survival curves for the elevated CEA patients who received perioperative or adjuvant chemotherapy, with two-year survival rates of 58% and 58%, respectively, with no statistical significance (P = 0.784); E: Survival curves for normal CEA patients who received perioperative or adjuvant chemotherapy, with a two-year survival rate of 59% and 48%, respectively. The difference is statistically significant (P = 0.024).
- Citation: Chen S, Chen YB, Li YF, Feng XY, Zhou ZW, Yuan XH, Qian CN. Normal carcinoembryonic antigen indicates benefit from perioperative chemotherapy to gastric carcinoma patients. World J Gastroenterol 2012; 18(29): 3910-3916
- URL: https://www.wjgnet.com/1007-9327/full/v18/i29/3910.htm
- DOI: https://dx.doi.org/10.3748/wjg.v18.i29.3910


