Copyright
©2012 Baishideng Publishing Group Co.
World J Gastroenterol. Jul 21, 2012; 18(27): 3537-3550
Published online Jul 21, 2012. doi: 10.3748/wjg.v18.i27.3537
Published online Jul 21, 2012. doi: 10.3748/wjg.v18.i27.3537
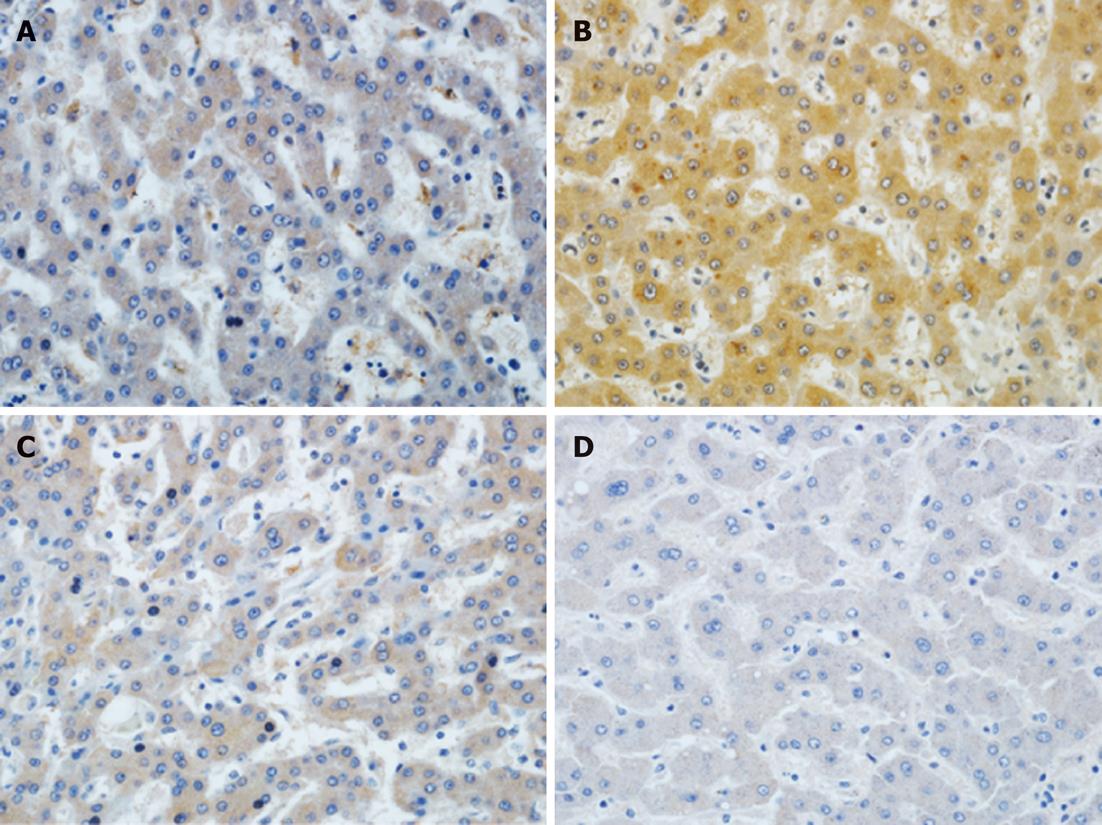
Figure 1 Immunohistochemical analysis of A20 expression in liver grafts on postoperative day 30.
Representative immunohistochemical sections from FK506 + physiological saline (A) treated livers demonstrate lower A20 expression compared to the substantial number of A20-positive liver cells in the FK506 + A20 treated liver grafts (B). Furthermore, the expression of FK506 + rAdEasy (C) is also low. D: The results of the normal control group (brown staining) (original magnification, 400 ×).
Figure 2 Representative liver fibrosis samples from FK506 + physiological saline treated group (A), FK506 + A20 treated group (B) and FK506 + rAdEasy -treated group (C) on postoperative day 60 (100 ×).
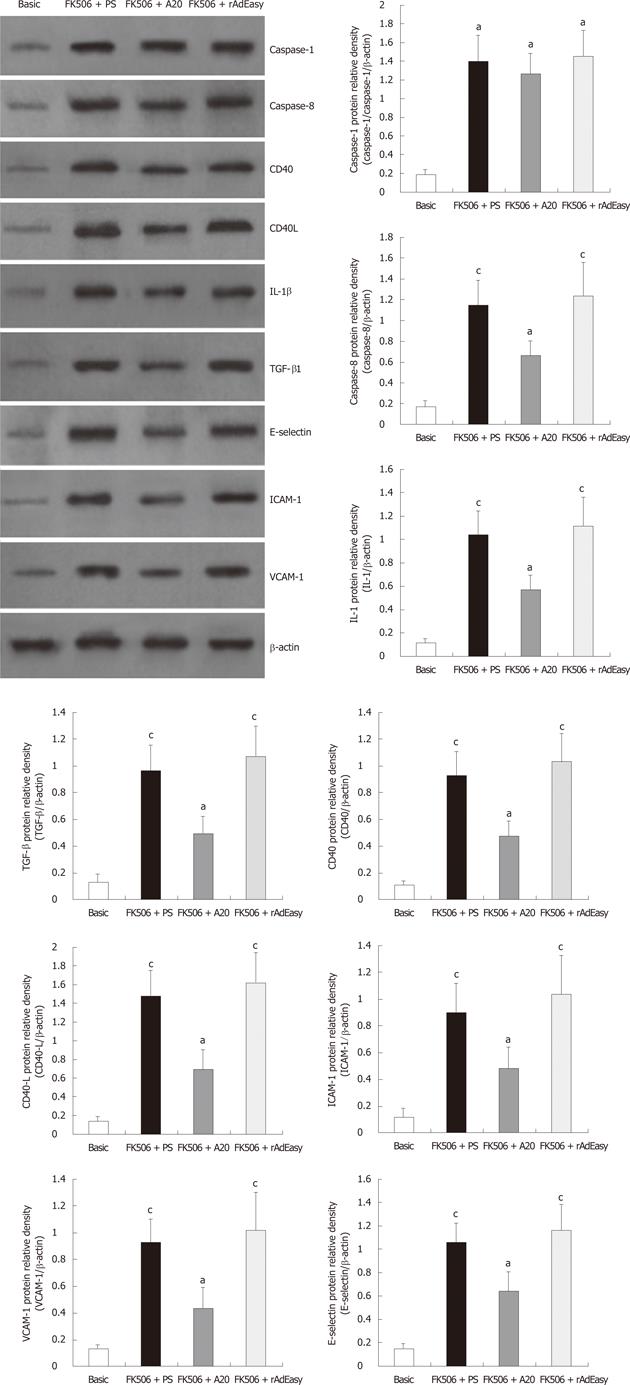
Figure 3 Western blotting analysis and densitometric analysis of associated cytokines in liver graft tissue.
Data were expressed as the relative intensity vsβ-actin. aP < 0.05 vs basic control; cP < 0.05 vs FK506 + A20. IL: Interleukin; TGF: Tumor growth factor; ICAM: Intercellular adhesion molecule; VCAM: Vascular cell adhesion molecule; PS: Physiological saline.
Figure 4 Terminal transferase dUTP nick end-labelling analysis of liver cells apoptosis (red stained) (original magnification, × 400).
Overexpressed A20 in liver graft resulted in a significantly decreased number of transferase dUTP nick end-labelling-positive liver cells (B) compared with physiological salinegroup rats (A) and rAdeasy group rats (C) (P < 0.01).
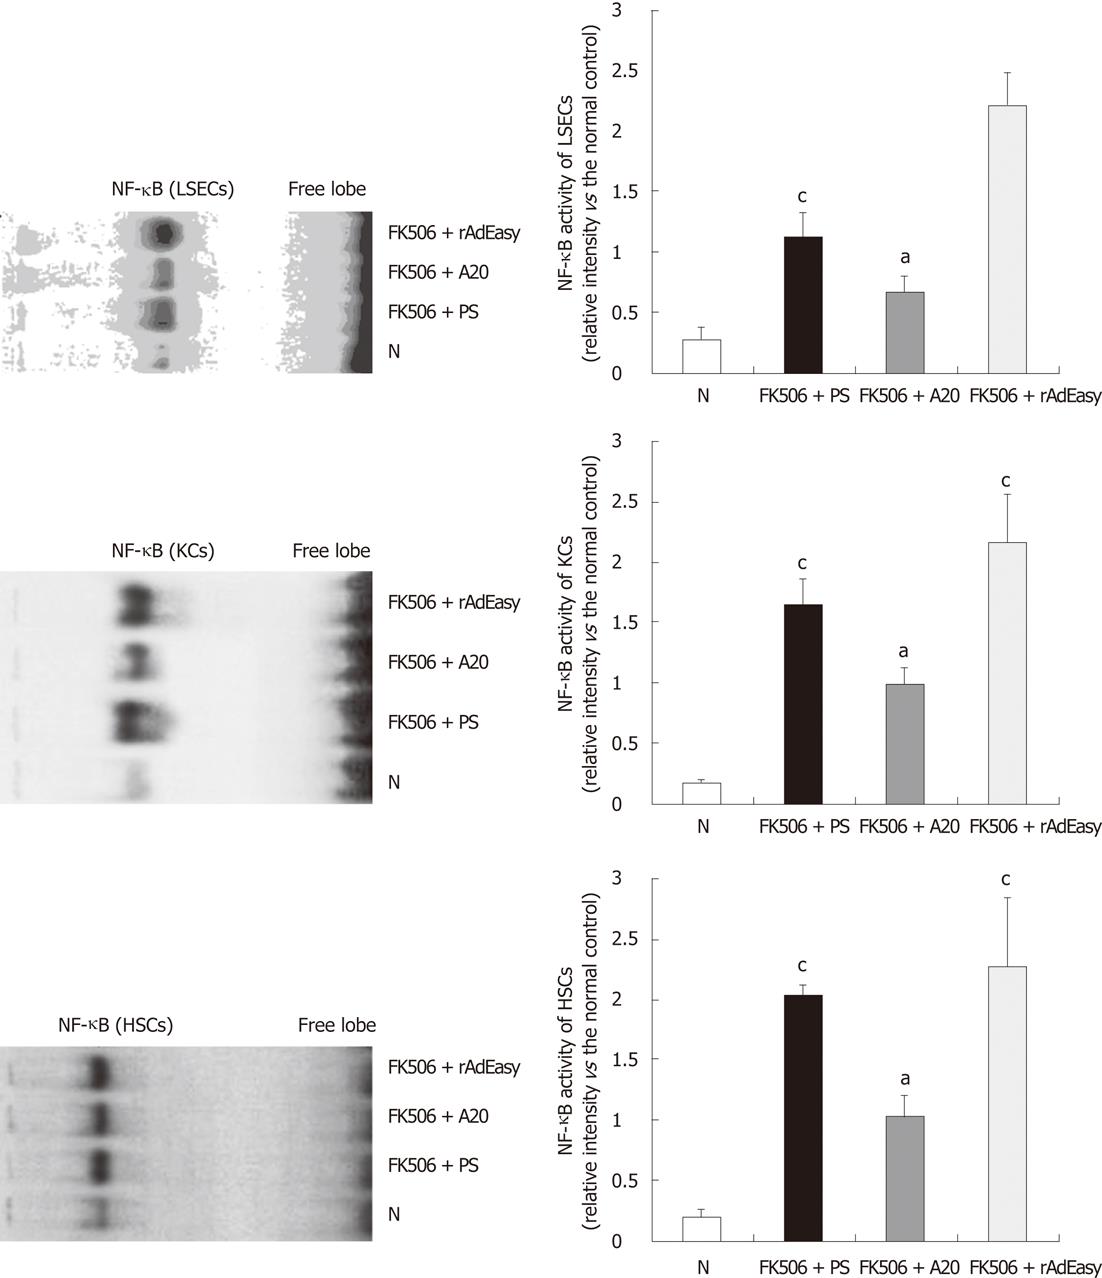
Figure 5 Effects of A20 on nuclear factor-κB activation in liver sinusoidal endothelial cells, Kupffer cells and hepatic stellate cells.
Nuclear factor-κB (NF-κB) activation on postoperative day (POD) 60 was determined by electrophoretic mobility shift assay (EMSA). Data were expressed as the relative intensity vs the normal basic control (N). aP < 0.05 vs basic control; cP < 0.05 vs FK506 + A20. LSECs: Liver sinusoidal endothelial cells; KCs: Kupffer cells; HSCs: Hepatic stellate cells.
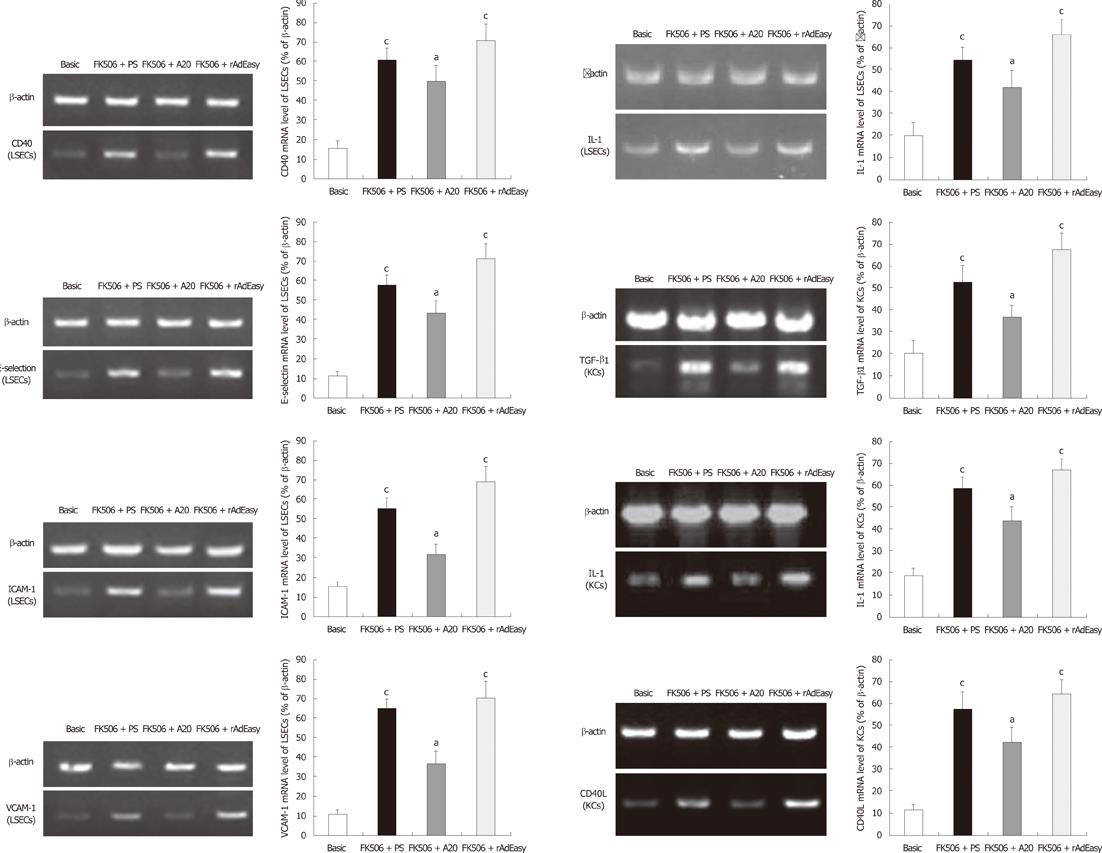
Figure 6 Cytokine mRNA expression in hepatic nonparenchymal cells on postoperative day 60 detected by reverse transcription polymerase chain reaction analysis.
Data were expressed as the relative intensity vsβ-actin. aP < 0.05 vs basic control; cP < 0.05 vs FK506 + A20. LSECs: Liver sinusoidal endothelial cells; ICAM: Intercellular adhesion molecule; KCs: Kupffer cells; VCAM: Vascular cell adhesion molecule; TGF: Tumor growth factor; IL: Interleukin.
- Citation: Yang J, Xu MQ, Yan LN, Chen XB, Liu J. Zinc finger protein A20 protects rats against chronic liver allograft dysfunction. World J Gastroenterol 2012; 18(27): 3537-3550
- URL: https://www.wjgnet.com/1007-9327/full/v18/i27/3537.htm
- DOI: https://dx.doi.org/10.3748/wjg.v18.i27.3537


