Copyright
©2012 Baishideng Publishing Group Co.
World J Gastroenterol. Jul 14, 2012; 18(26): 3451-3457
Published online Jul 14, 2012. doi: 10.3748/wjg.v18.i26.3451
Published online Jul 14, 2012. doi: 10.3748/wjg.v18.i26.3451
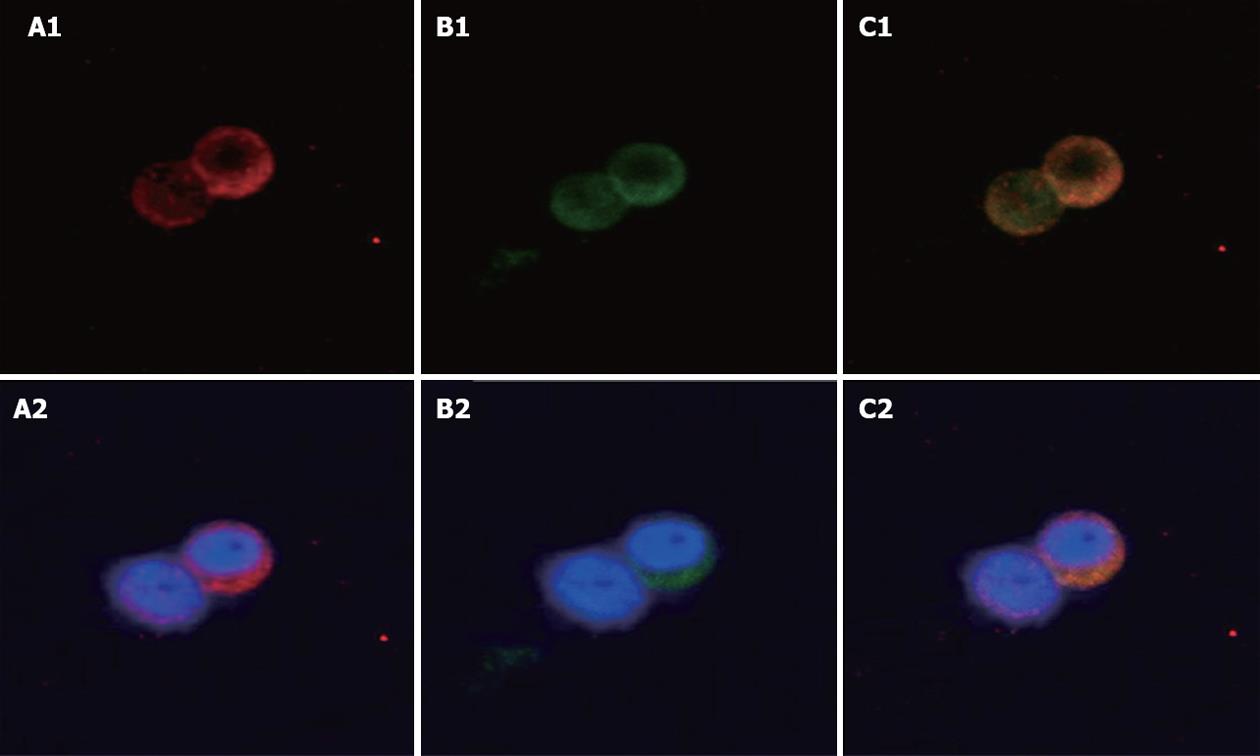
Figure 1 Localization of uncoupling protein-2 and glucagon-like peptide-1 in NCI-H716 cells.
Immunofluorescence staining in human NCI-H716 cells which serve as a model for L-cells. A1, A2: Glucagon-like peptide-1 (GLP-1) antibody staining (red); B1, B2: Uncoupling protein-2 (UCP2) antibody staining (green); C1, C2: Merged image shows co-expression of UCP2 and GLP-1. Blue (Hoechst) staining indicates the nuclei. Original magnification, ¡Á 400.
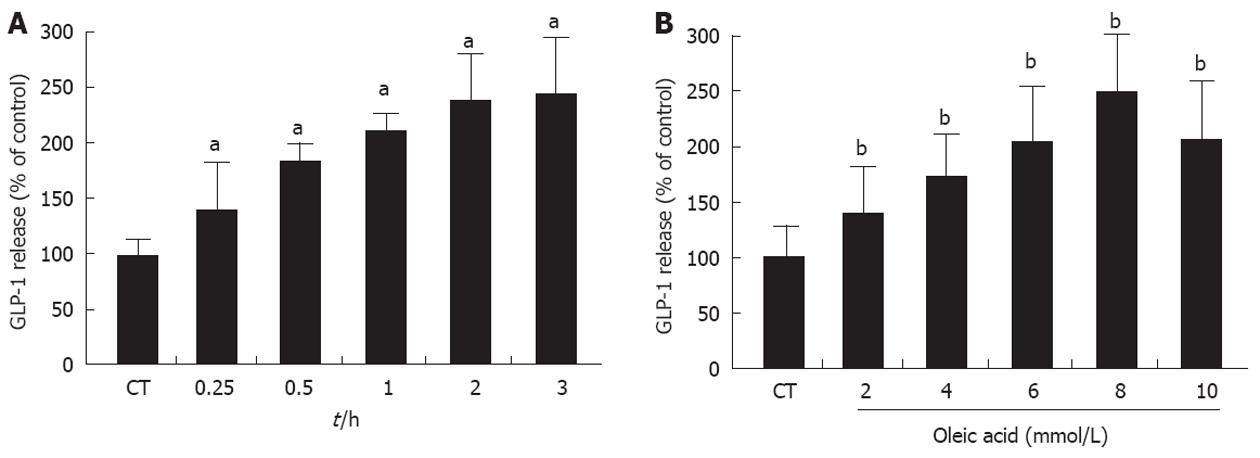
Figure 2 Glucagon-like peptide-1 secretion in NCI-H716 cells after treatment with oleic acid.
A: Time course of oleic acid-induced release of glucagon-like peptide-1 (GLP-1) from NCI-H716 cells. NCI-H716 cells were incubated with 8 mmol oleic acid, and the culture medium was collected at 0.25, 0.5, 1, 2, and 3 h to detect GLP-1 levels; B: Dose-dependent oleic acid-induced release of GLP-1 from NCI-H716 cells. NCI-H716 cells were incubated with 2, 4, 6, 8, and 10 mmol oleic acid for 2 h. The culture medium was then analyzed for GLP-1 concentration. NCI-H716 cells without oleic acid exposure. aP < 0.05, bP < 0.01 vs baseline value.
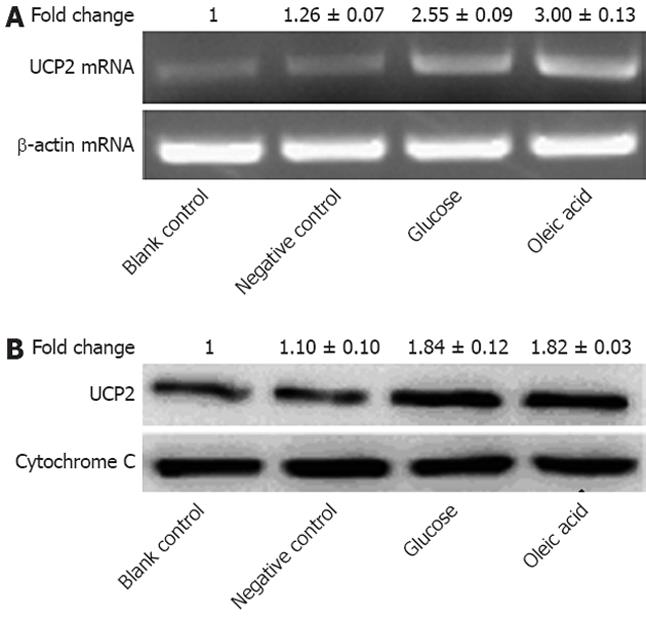
Figure 3 Expression of uncoupling protein-2 in NCI-H716 cells after treatment with oleic acid.
A: Total RNA was extracted, and relative mRNA levels of uncoupling protein-2 (UCP2) were determined by quantitative reverse transcriptase polymerase chain reaction with normalization to β-actin (P < 0.05); B: UCP2 protein was detected by western blotting. Cytochrome C was used as the loading control (P < 0.01); Individual data points in this figure represent the mean ± SE of 12 determinants from four independently prepared samples each with three measurements. NCI-H716 cells were incubated with medium alone (blank control), medium containing 1% dimethyl sulfoxide (negative control), medium with 30 mmol glucose (glucose), and medium with 8 mmol oleic acid (oleic acid).
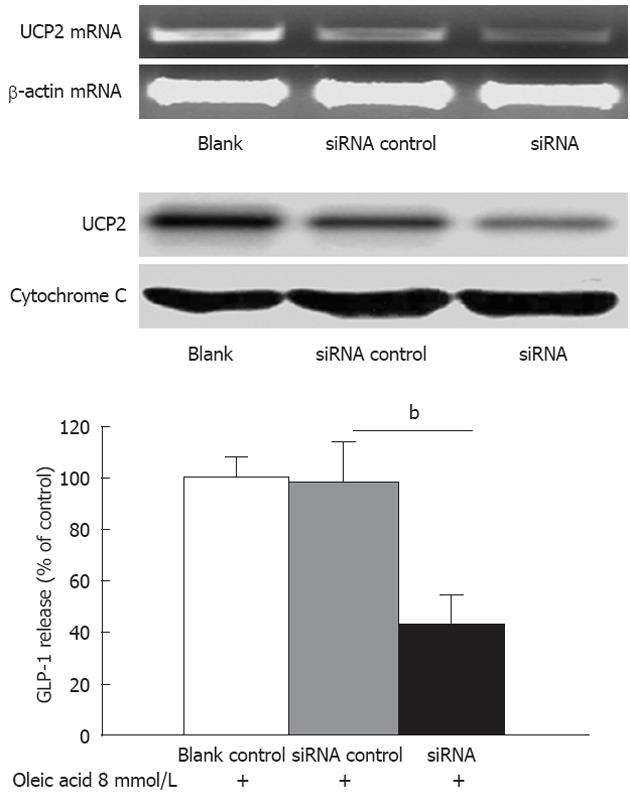
Figure 4 Knockdown of uncoupling protein-2 expression decreased oleic acid-induced secretion of glucagon-like peptide-1 in NCI-H716 cells.
Up panel: The knock-down efficiency of small interfering RNA which targets UCP2 (siUCP2) in NCI-H716 cells. NCI-H716 cells were left untransfected (blank), were mock transfected (no siRNA), or were transfected with siUCP2. After 48 h, the mRNA levels of uncoupling protein-2 were determined as in Figure 4. Protein levels were determined as in Figure 4; Down panel: Effects of oleic acid on levels of secreted glucagon-like peptide-1 (GLP-1). NCI-H716 cells were transfected as described above and were then incubated with 8 mmol oleic acid for 2 h. GLP-1 concentrations were determined as in Figure 4. bP < 0.01 vs siRNA control.
- Citation: Chen Y, Li ZY, Yang Y, Zhang HJ. Uncoupling protein 2 regulates glucagon-like peptide-1 secretion in L-cells. World J Gastroenterol 2012; 18(26): 3451-3457
- URL: https://www.wjgnet.com/1007-9327/full/v18/i26/3451.htm
- DOI: https://dx.doi.org/10.3748/wjg.v18.i26.3451


