Copyright
©2012 Baishideng Publishing Group Co.
World J Gastroenterol. Jul 7, 2012; 18(25): 3215-3222
Published online Jul 7, 2012. doi: 10.3748/wjg.v18.i25.3215
Published online Jul 7, 2012. doi: 10.3748/wjg.v18.i25.3215
Figure 1 Predictive value of parameters on 18F-fluorodeoxyglucose positron emission tomography.
Tsuvmax/Lsuvmean (C) demonstrated the highest area under curve based on the receiver-operating-characteristic curve analysis compared to Tsuvmax (A), and Tsuvmax/Lsuvmax (B). AUC: Area under curve.
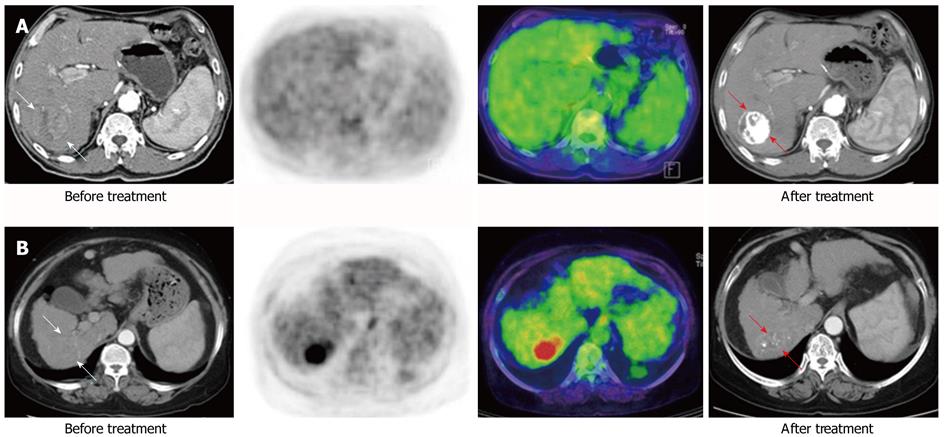
Figure 2 Baseline and follow-up images after treatment of fluorodeoxyglucose uptake according to the Tsuvmax/Lsuvmean ratio.
A: Patient with nodular hepatocellular carcinoma (HCC) (white arrow) based on liver dynamic computed tomography (CT) showed fluorodeoxyglucose (FDG) uptake with a low Tsuvmax/Lsuvmean ratio (< 1.90) in 18F-FDG positron emission tomography/CT. After transarterial chemo embolization, this patient showed compact lipiodol uptake (red arrow) on follow-up liver CT; B: Patient with infiltrative type HCC (white arrow) in liver dynamic CT showed FDG uptake with a high Tsuvmax/Lsuvmean ratio (≥ 1.90). This patient showed faint lipiodol uptake (red arrow) in a follow-up liver CT. The patent with a low standardized uptake value (SUV) ratio showed improved treatment response and survival over the patient with a high SUV ratio (complete response vs stable disease, 782 d vs 167 d, respectively).
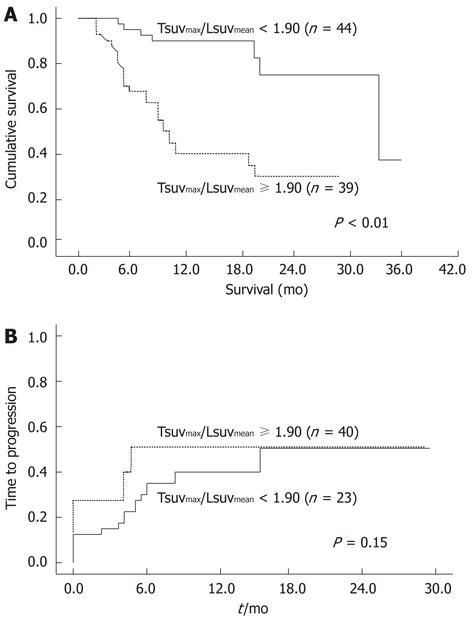
Figure 3 Overall survival and time to progression rates according to Tsuvmax/Lsuvmean level.
A: Patients exhibiting low Tsuvmax/Lsuvmean (< 1.90) survived longer than those with high Tsuvmax/Lsuvmean (≥ 1.90); B: No significant difference of progression was evident between patients exhibiting low Tsuvmax/Lsuvmean and those with high Tsuvmax/Lsuvmean. SUV: Standardized uptake value.
- Citation: Song MJ, Bae SH, Yoo IR, Park CH, Jang JW, Chun HJ, Choi BG, Lee HG, Choi JY, Yoon SK. Predictive value of 18F-fluorodeoxyglucose PET/CT for transarterial chemolipiodolization of hepatocellular carcinoma. World J Gastroenterol 2012; 18(25): 3215-3222
- URL: https://www.wjgnet.com/1007-9327/full/v18/i25/3215.htm
- DOI: https://dx.doi.org/10.3748/wjg.v18.i25.3215


