Copyright
©2012 Baishideng Publishing Group Co.
World J Gastroenterol. Jun 28, 2012; 18(24): 3129-3137
Published online Jun 28, 2012. doi: 10.3748/wjg.v18.i24.3129
Published online Jun 28, 2012. doi: 10.3748/wjg.v18.i24.3129
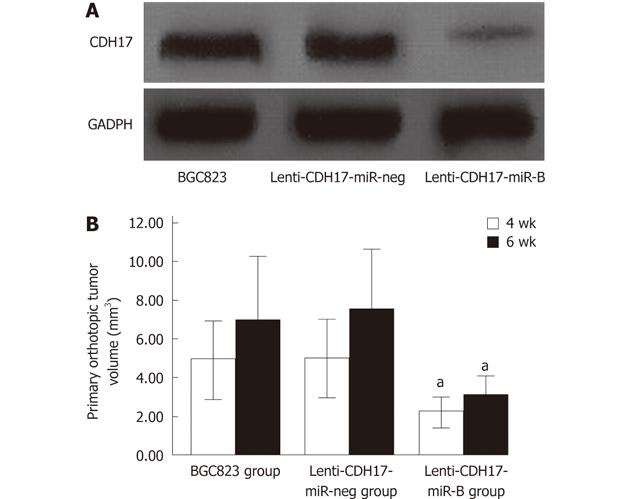
Figure 1 Tumorigenicity is inhibited by knockdown of liver-intestine cadherin using Lenti-microRNA in BGC823 cells.
A: Knockdown of liver-intestine cadherin (CDH17) in lenti-CDH17-miR-B cells was confirmed by western blotting; B: The primary orthotopic tumor volume in the lenti-CDH17-miR-B group was much lower than that of the BGC823 and lenti-CDH17-miR-neg groups during the observation periods (aP < 0.05). Data represent the mean ± SD (n = 6). P-values for the indicated comparisons were determined with one-way analysis of variance.
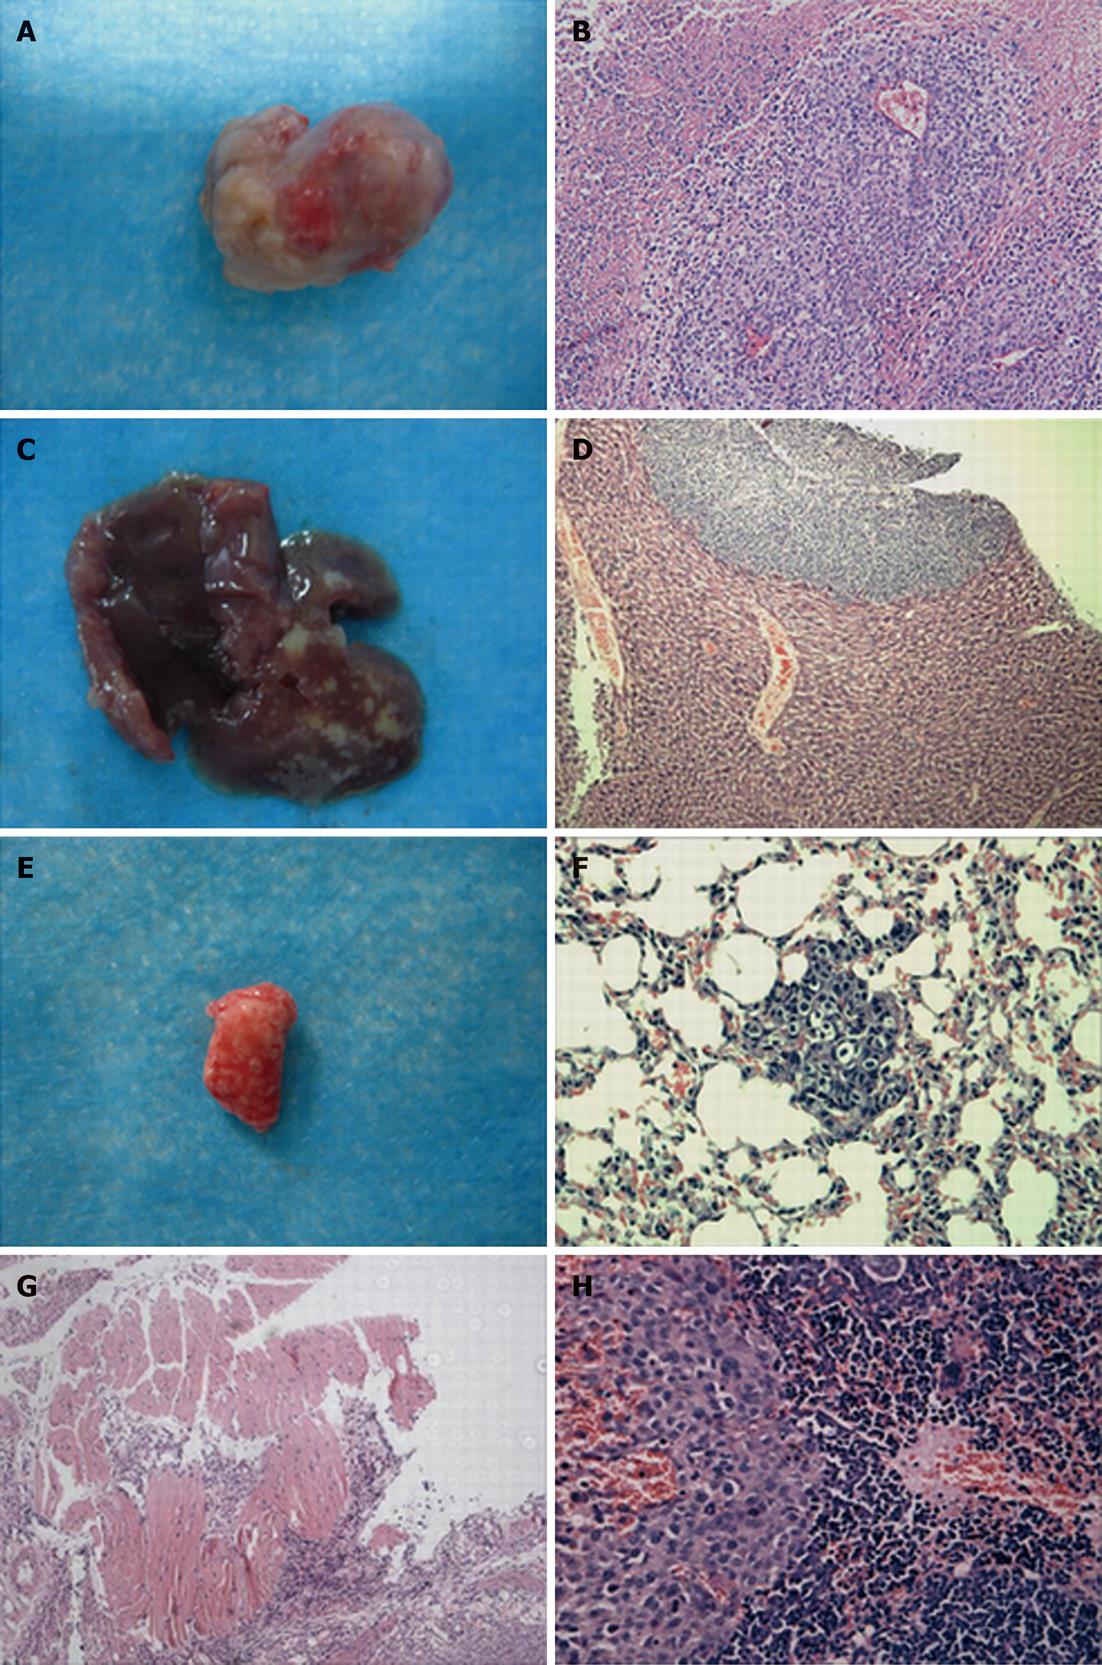
Figure 2 Tumors in which liver-intestine cadherin was knocked down show fewer invasive characteristics in vivo.
Hematoxylin-eosin staining revealed that primary orthotopic tumors (A, B) derived from BGC823 or lenti-liver-intestine cadherin (CDH17)-miR-neg cells spread into the liver (C, D) and lung (E, F) more frequently than those derived from lenti-CDH17-miR-B cells. Nude mice injected with these two types of tumors also showed invasion of the diaphragmatic muscle (G) and spleen (H).
Figure 3 Local injection of liver-intestine cadherin-RNA interference-lentivirus suppresses the growth of established tumors in nude mice.
A, B: Representative photographs of one mouse in each group 1 wk after the final injection of green fluorescent protein (GFP)-lentivirus or liver-intestine cadherin (CDH17)-RNA interference (RNAi)-lentivirus; C, D: Representative photographs of tumors isolated from one mouse in each group 1 wk after the final injection of GFP-lentivirus or CDH17-RNAi-lentivirus; E, F: Hematoxylin-eosinstaining of xenotransplanted tumors: Ccontrol group (E); CDH17-RNAi-lentivirus-treated group (F); G, H: Immunohistochemistry showed knockdown of CDH17 by intratumoral injection of CDH17-RNAi-lentivirus (SP × 200).
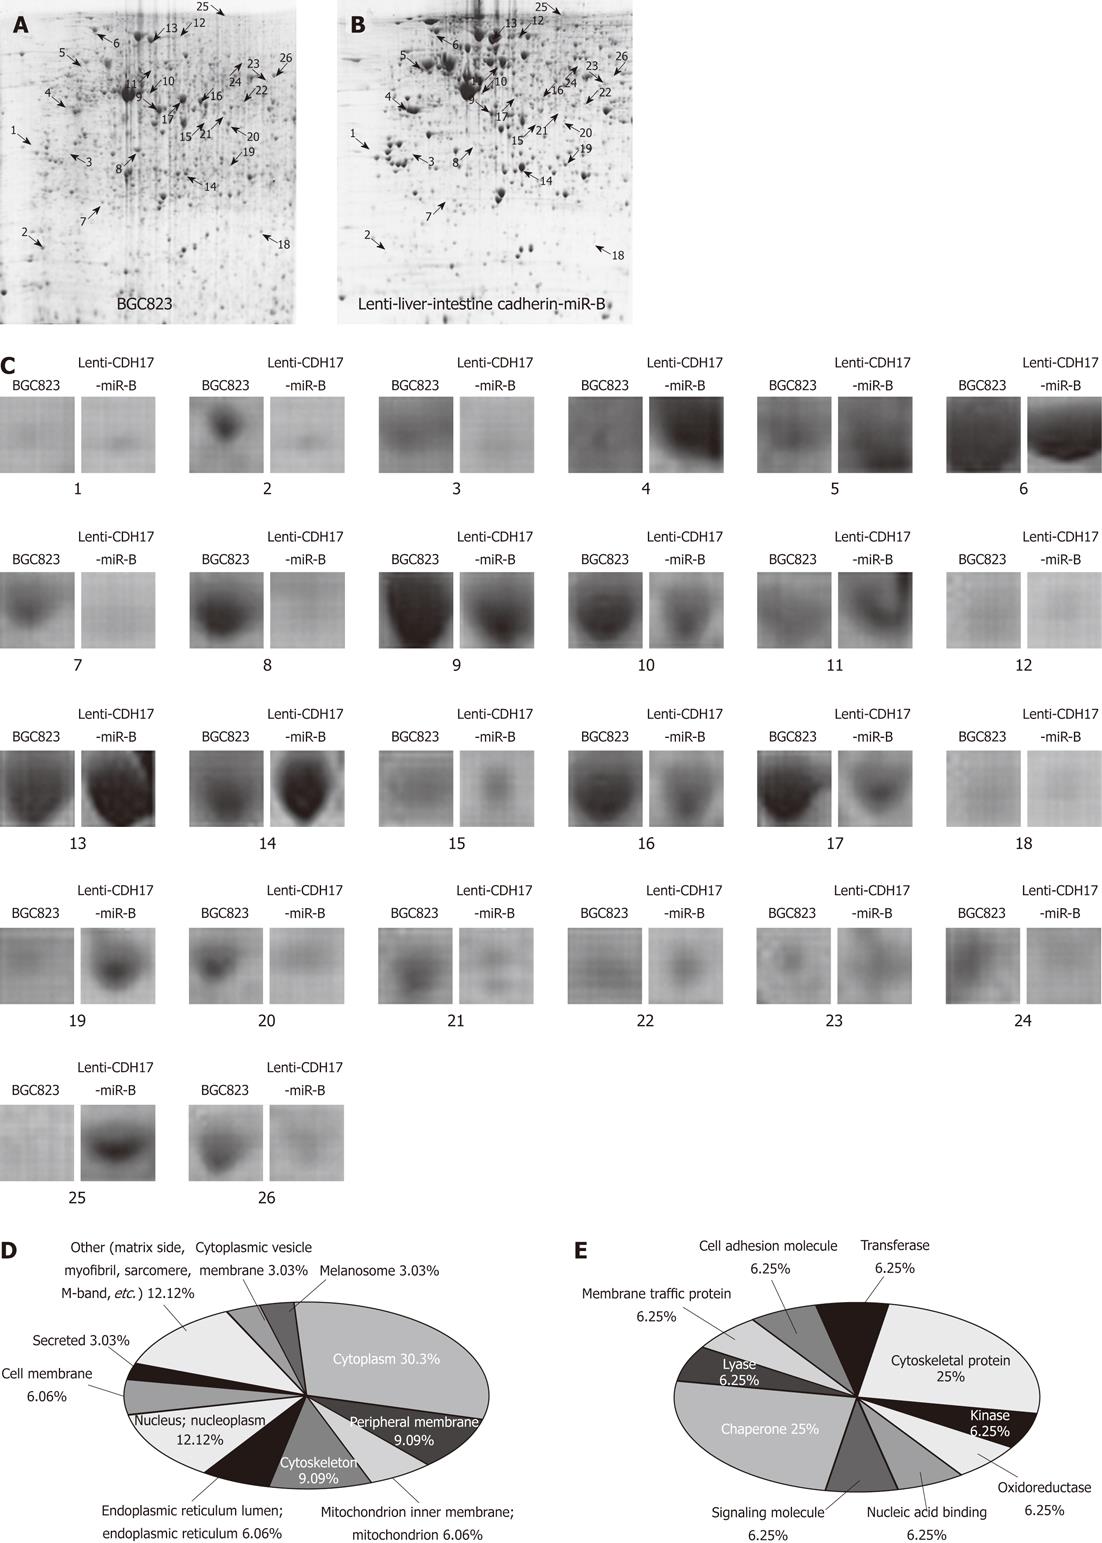
Figure 4 Protein profile differences between lenti-liver-intestine cadherin-miR-B and BGC823 cells.
A, B: Comparison of protein profiles by 2-dimensional gel electrophoresis between BGC823 and lenti-liver-intestine cadherin (CDH17)-miR-B cells; C: Close-up image of differential expression of protein spots with intensity alterations > 3-fold and recurrence four or more times in independent experiments. The average intensity of each spot was determined using PDQuest 2-DE software; D: Cellular location of the 15 altered proteins identified by mass spectrometry; E: Molecular functions of the 15 altered proteins identified by mass spectrometry.
-
Citation: Xu Y, Zhang J, Liu QS, Dong WG. Knockdown of liver-intestine cadherin decreases BGC823 cell invasiveness and metastasis
in vivo . World J Gastroenterol 2012; 18(24): 3129-3137 - URL: https://www.wjgnet.com/1007-9327/full/v18/i24/3129.htm
- DOI: https://dx.doi.org/10.3748/wjg.v18.i24.3129


