Copyright
©2012 Baishideng Publishing Group Co.
World J Gastroenterol. Jun 7, 2012; 18(21): 2719-2726
Published online Jun 7, 2012. doi: 10.3748/wjg.v18.i21.2719
Published online Jun 7, 2012. doi: 10.3748/wjg.v18.i21.2719
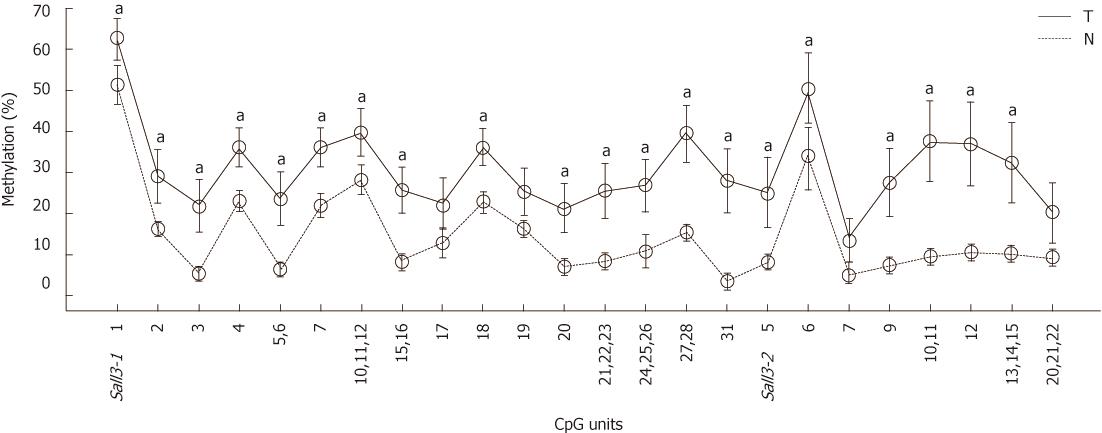
Figure 1 Average methylation levels were calculated from 38 tumors (T) and adjacent non-cancerous tissues (N) on 24 CpG units from sall3 CpG island respectively.
The data was analyzed by Wilcox rank sum test (aP < 0.05 vs non-cancerous tissues ). Error bar, 95% confidence interval.
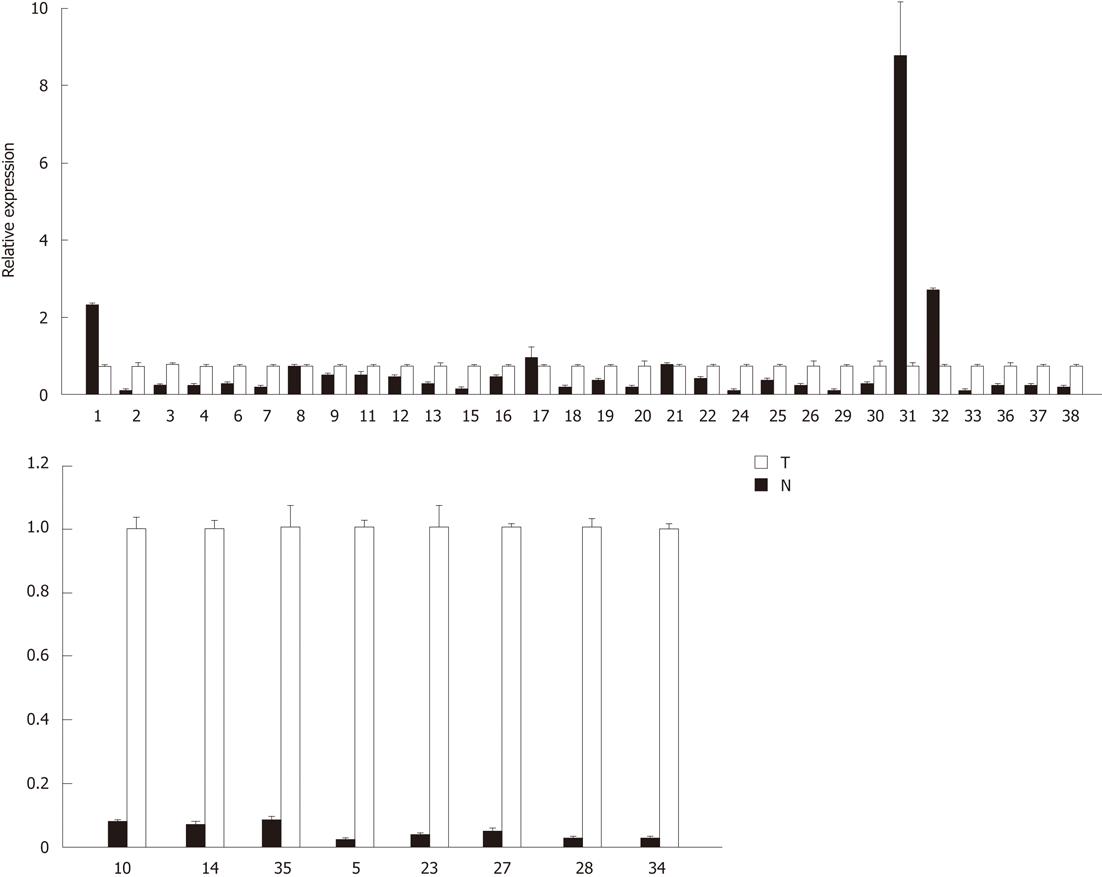
Figure 2 sall3 mRNA is analyzed in 38 tumor tissues (T) and adjacent non-cancerous tissues (N).
Error bars, SD from triplicates.
Figure 3 Correlation between methylation levels and mRNA expression of sall3 in 24 tumor tissues and corresponding adjacent noncancerous tissues.
Figure 4 Quantitative methylation analysis on each CpG unit of sall3 CpG island in HCC cells after 5-Aza-CdR treatment or control (A-F).
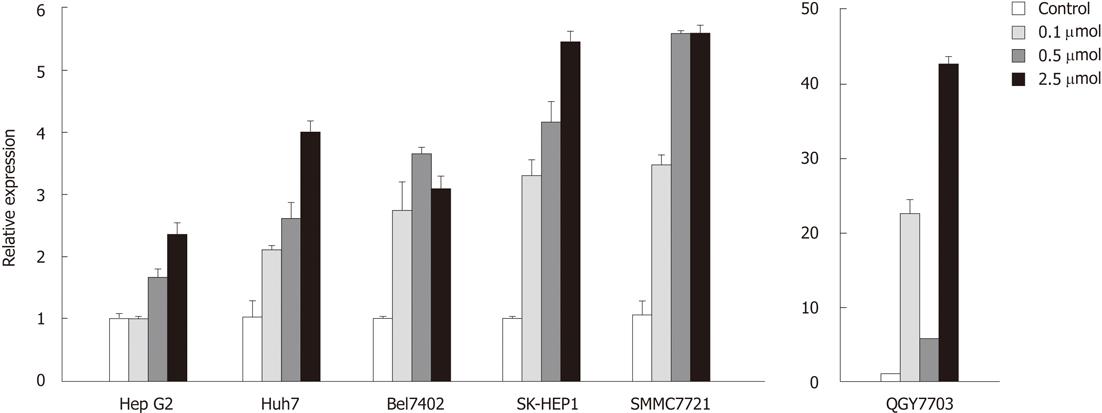
Figure 5 Relative sall3 expression in six hepatocellular carcinoma cells after 5-AZA-CdR treatment.
Error bars, SD from triplicates.
-
Citation: Yang XX, Sun JZ, Li FX, Wu YS, Du HY, Zhu W, Li XH, Li M. Aberrant methylation and downregulation of
sall3 in human hepatocellular carcinoma. World J Gastroenterol 2012; 18(21): 2719-2726 - URL: https://www.wjgnet.com/1007-9327/full/v18/i21/2719.htm
- DOI: https://dx.doi.org/10.3748/wjg.v18.i21.2719


