Copyright
©2012 Baishideng Publishing Group Co.
World J Gastroenterol. May 28, 2012; 18(20): 2472-2480
Published online May 28, 2012. doi: 10.3748/wjg.v18.i20.2472
Published online May 28, 2012. doi: 10.3748/wjg.v18.i20.2472
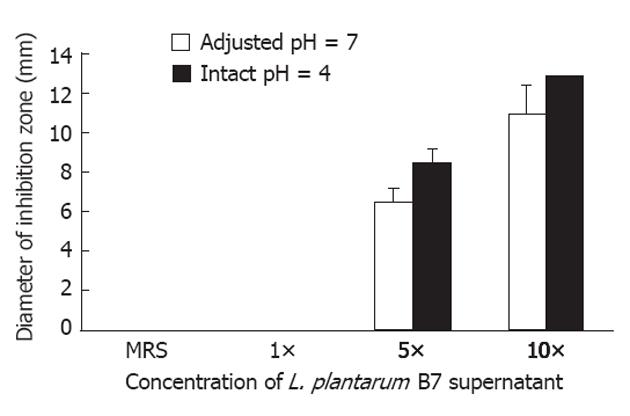
Figure 1 A bar graph shows the mean ± SD of inhibitory zone diameters (mm) of all Lactobacillus plantarum B7 supernatant concentrations at intact pH 4 and adjusted pH 7 (n = 2).
L. plantarum: Lactobacillus plantarum; MRS: Man-Rogosa-Sharpe.
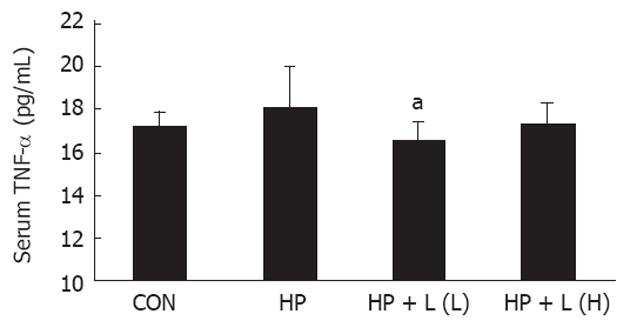
Figure 2 A bar graph shows the mean ± SD of serum tumor necrosis factor-alpha level (pg/mL) in all groups.
CON: Control group; HP: Helicobacter pylori (H. pylori) infected group; HP + L (L): Lactobacillus plantarum (L. plantarum) B7 106 CFUs/mL treated group; HP + L (H): L. plantarum B7 1010 CFUs/mL treated group. Each group is represented by the mean of 8 rats. aP < 0.05 vs H. pylori infected group. TNF-α: Tumor necrosis factor-alpha.
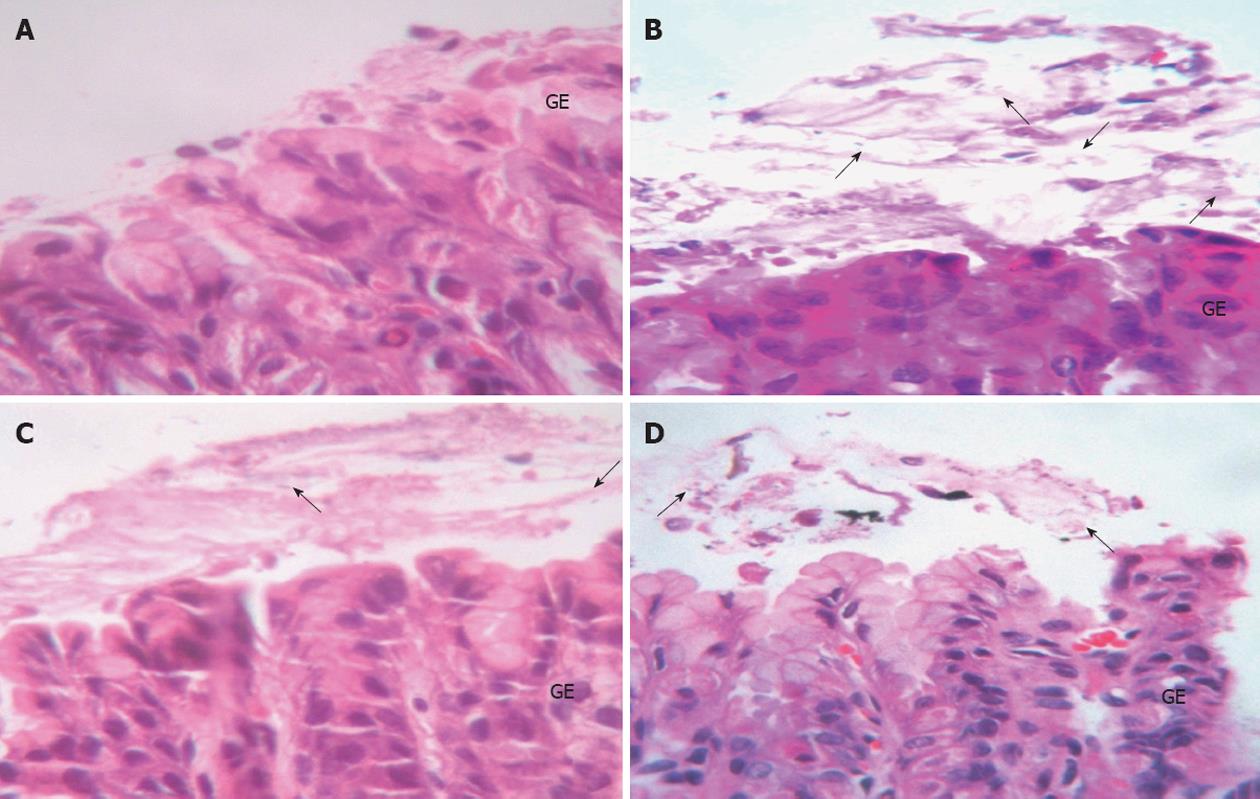
Figure 3 Hematoxylin-eosin stained gastric sections (×40).
A: Control group showed no Helicobacter pylori (H. pylori); B: H. pylori infected group showed colonization (arrows) of H. pylori; C and D: Lactobacillus plantarum (L. plantarum) B7 106 CFUs/mL treated and L. plantarum B7 1010 CFUs/mL treated groups showed decreased H. pylori colonization. GE: Gastric epithelium.
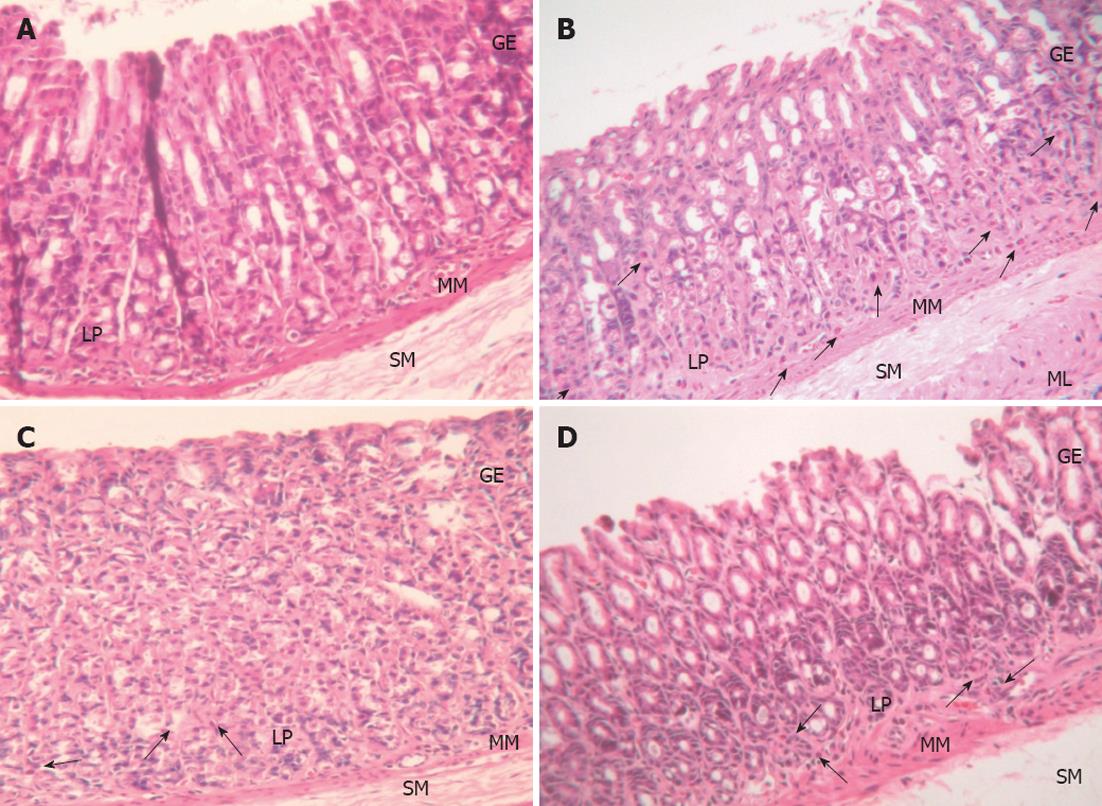
Figure 4 Hematoxylin-eosin stained gastric sections (×20).
A: Control group showed normal gastric histopathology; B: Helicobacter pylori infected group showed infiltration of inflammatory cells (arrows); C and D: Lactobacillus plantarum (L. plantarum) B7 106 CFUs/mL treated and L. plantarum B7 1010 CFUs/mL treated groups showed improvements in gastric inflammation. GE: Gastric epithelium; LP: Lamina propria; MM: Muscularis mucosae; SM: Submucosa; ML: Muscularis.
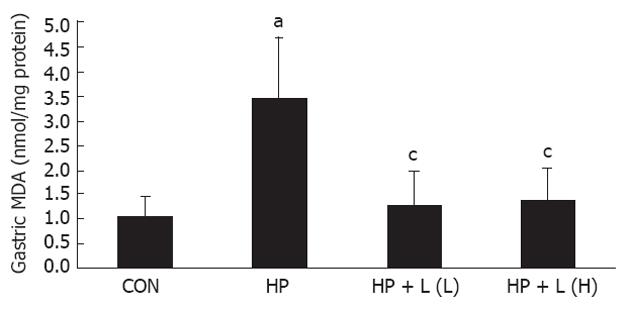
Figure 5 A bar graph shows the mean ± SD of gastric malondialdehyde levels (nmol/mg protein) in all groups.
CON: Control group; HP: Helicobacter pylori (H. pylori) infected group; HP + L (L): Lactobacillus plantarum (L. plantarum) B7 106 CFUs/mL treated group; HP + L (H): L. plantarum B7 1010 CFUs/mL treated group. Each group is represented by the mean of 8 rats. aP < 0.05 vs control group; cP < 0.05 vs H. pylori infected group. MDA: Malondialdehyde.
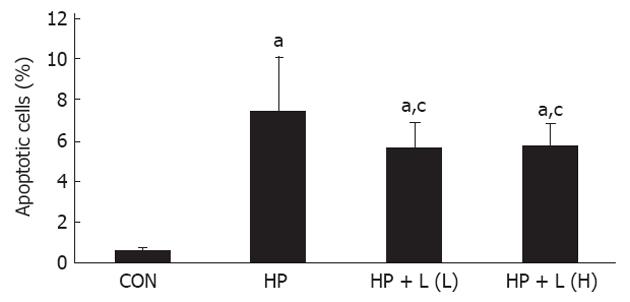
Figure 6 A bar graph shows the mean ± SD of apoptotic cells (%) in all groups.
CON: Control group; HP: Helicobacter pylori (H. pylori) infected group; HP + L (L): Lactobacillus plantarum (L. plantarum) B7 106 CFUs/mL treated group; HP + L (H): L. plantarum B7 1010 CFUs/mL treated group. Each group is represented by the mean of 8 rats. aP < 0.05 vs control group; cP < 0.05 vs H. pylori infected group.
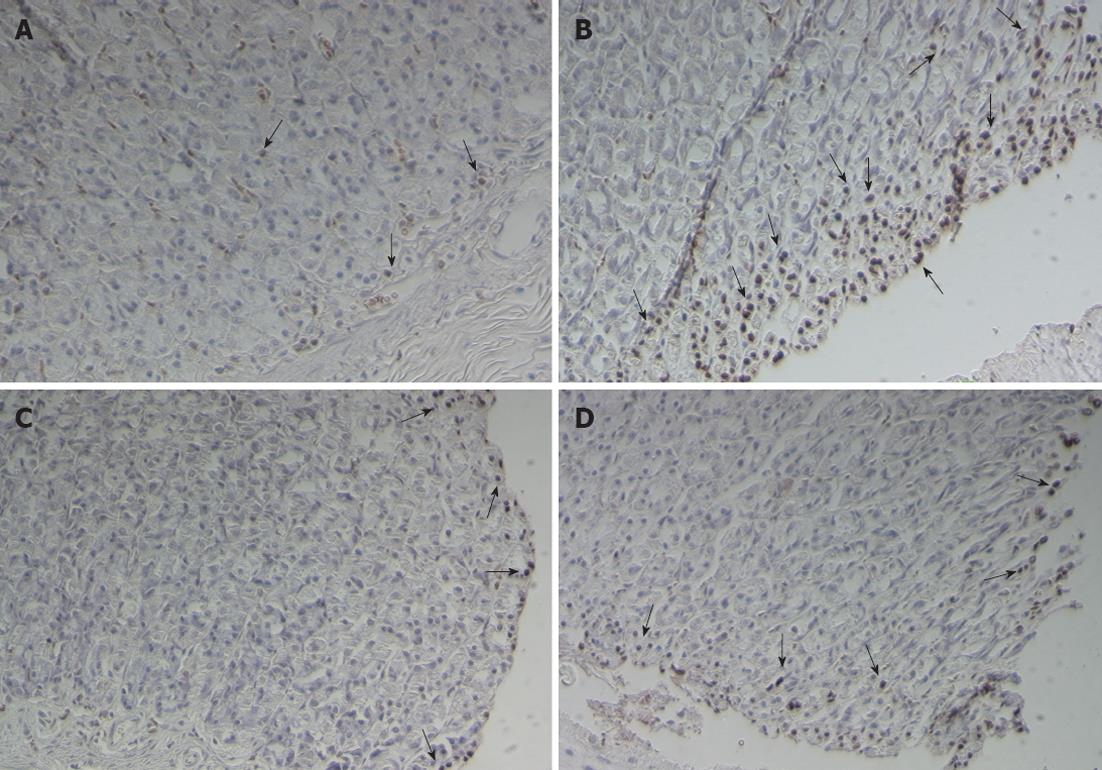
Figure 7 Representative gastric sections processed for the apoptosis assay by terminal deoxynucleotidyl transferase-mediated dUTP nick-end labeling reaction (×20).
A: Control group; B: Helicobacter pylori infected group; C and D: Lactobacillus plantarum (L. plantarum) B7 106 CFUs/mL treated and L. plantarum B7 1010 CFUs/mL treated groups showed a decrease in gastric epithelium apoptosis. The arrows indicate terminal deoxynucleotidyl transferase-mediated dUTP nick-end labeling-positive gastric epithelial cell apoptosis.
-
Citation: Sunanliganon C, Thong-Ngam D, Tumwasorn S, Klaikeaw N.
Lactobacillus plantarum B7 inhibitsHelicobacter pylori growth and attenuates gastric inflammation. World J Gastroenterol 2012; 18(20): 2472-2480 - URL: https://www.wjgnet.com/1007-9327/full/v18/i20/2472.htm
- DOI: https://dx.doi.org/10.3748/wjg.v18.i20.2472


