Copyright
©2012 Baishideng Publishing Group Co.
World J Gastroenterol. Jan 14, 2012; 18(2): 136-143
Published online Jan 14, 2012. doi: 10.3748/wjg.v18.i2.136
Published online Jan 14, 2012. doi: 10.3748/wjg.v18.i2.136
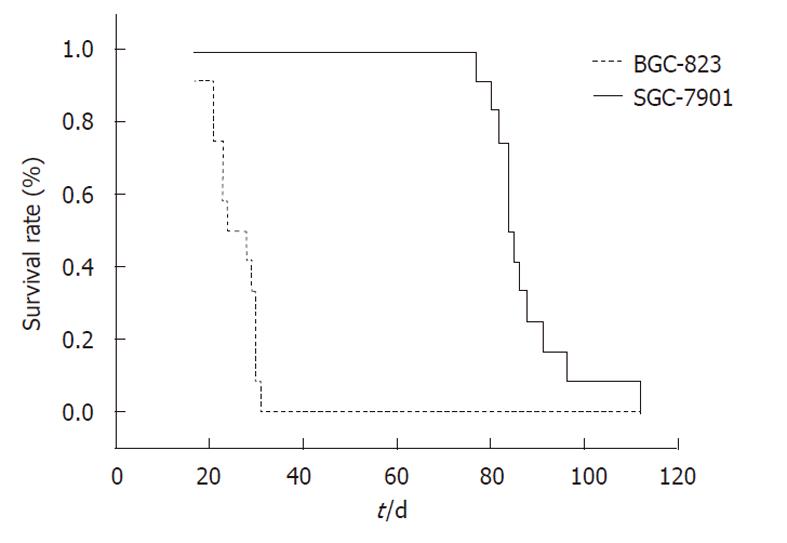
Figure 1 Survival curve of the SGC-7901 and BGC-823 gastric cancer models.
The median survival in the BGC-823 model is significantly shorter than that in SGC-7901 (23 d vs 84 d, P < 0.05).
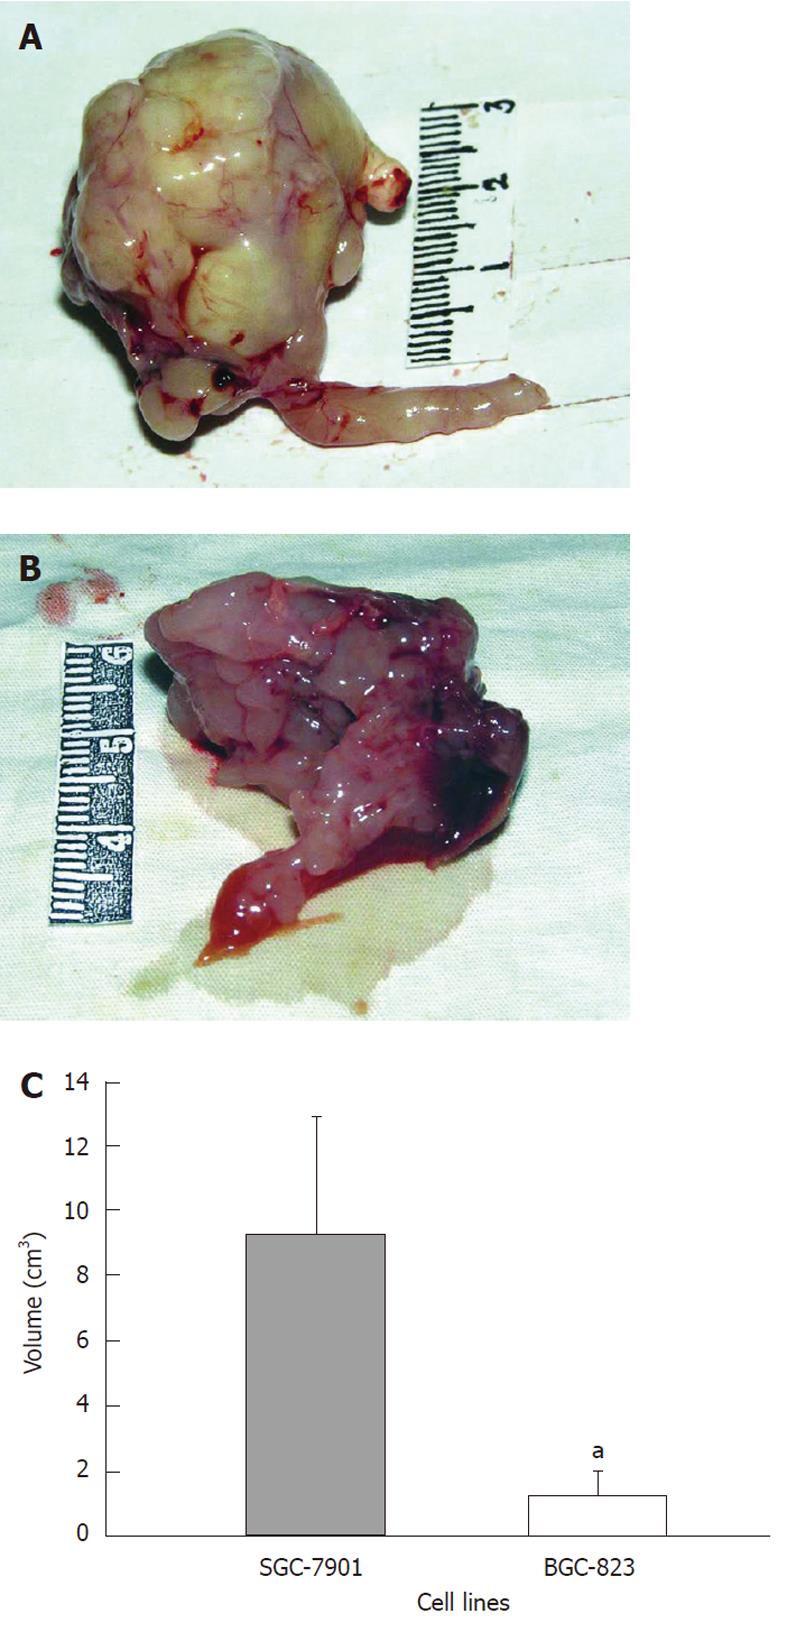
Figure 2 Macroscopic examination of the primary tumor in the two models.
A: The tumor of SGC-7901 shows large volume (9.30 ± 3.62 cm3), irregular lobular shape, and stenosis in the cardia or pylorus; B: The tumor volume of BGC-823 is 1.24 ± 0.73 cm3, with irregular lobular appearance; C: Comparison of primary tumor volume in two models. The difference is statistically significant. aP < 0.05, student t test.
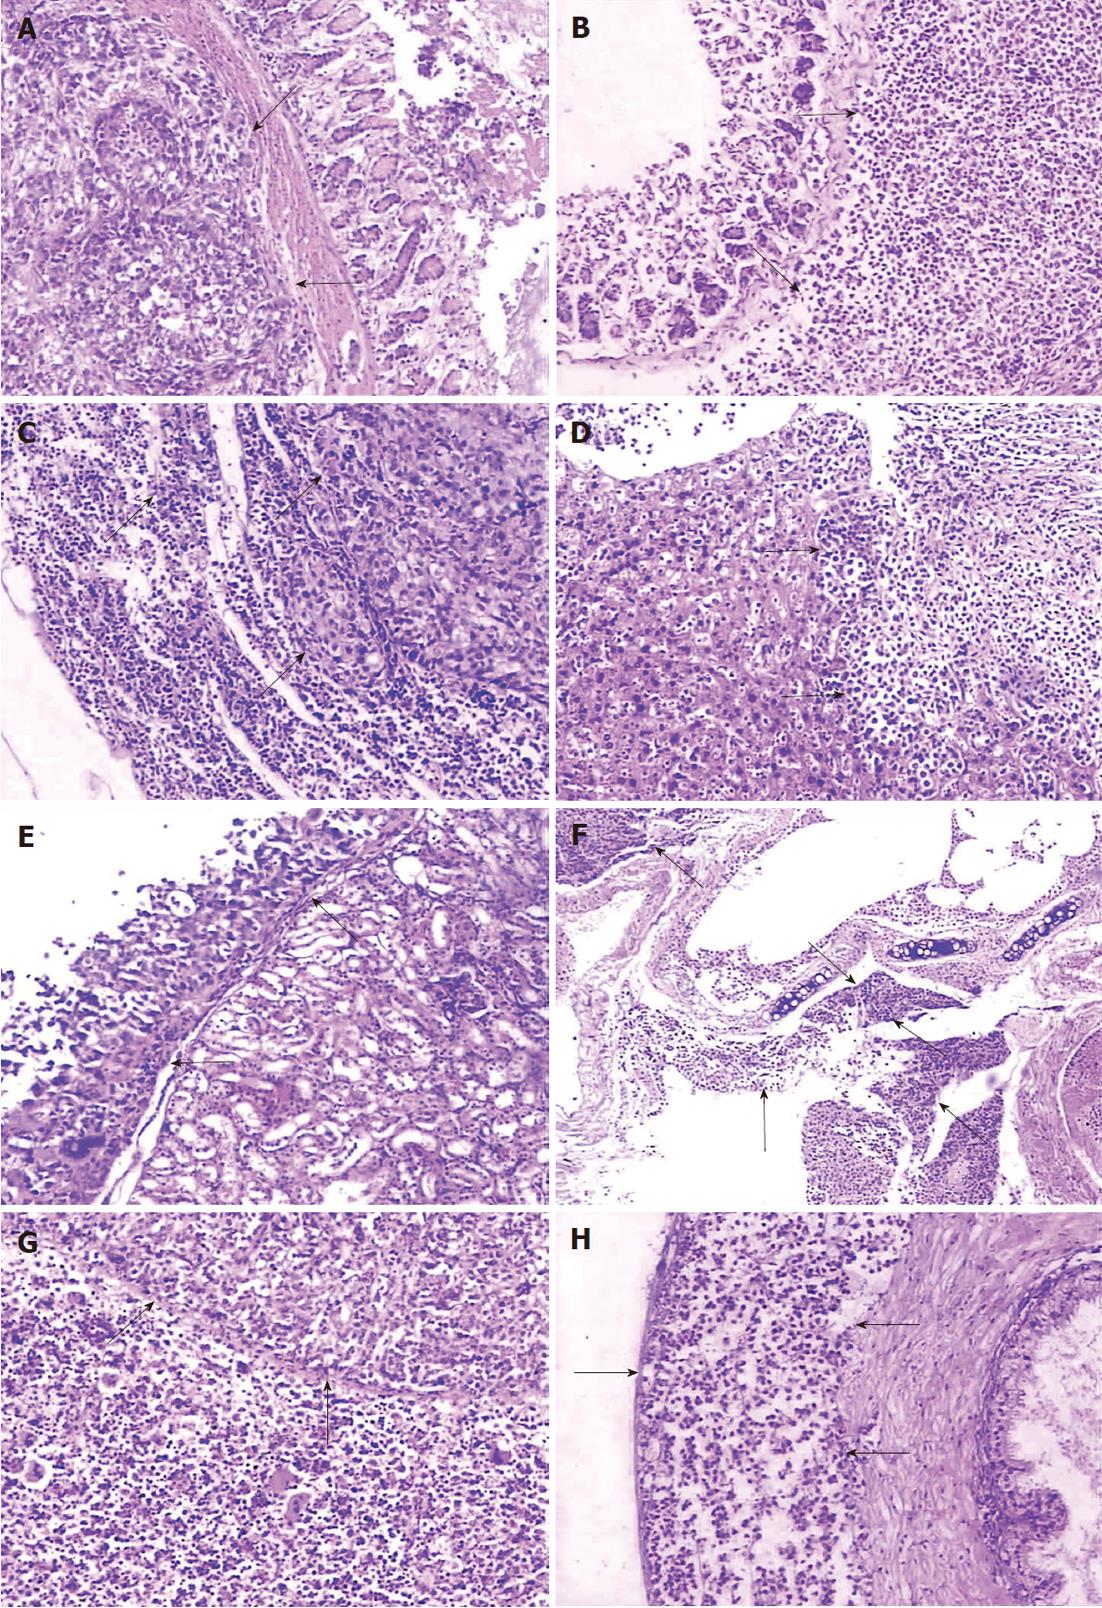
Figure 3 Histology of the primary tumor and metastasis in the two models by hematoxylin and eosin staining.
The tumor cells of the SGC-7901 (A) and the BGC-823 (B) model infiltrate the submucosa of the stomach; C: Tumor cells (arrows) are found in the subcapsular and cortical areas of lymph node of the SGC-7901 model; D: Metastases (arrows) detected in the liver of the BGC-823 model; E: Tumor invades into the kidney of the SGC-7901 model, with a fibrous capsule surrounding relatively normal renal tissue (arrows); F: Tumor metastasizes to the lung and surrounds the bronchium in the BGC-823 model; Other organs (G: Spleen; H: Testicle) with metastasis involvement in the BGC-823 model. Tumors are marked with arrows. Hematoxylin and eosin stain; Magnification, × 100.
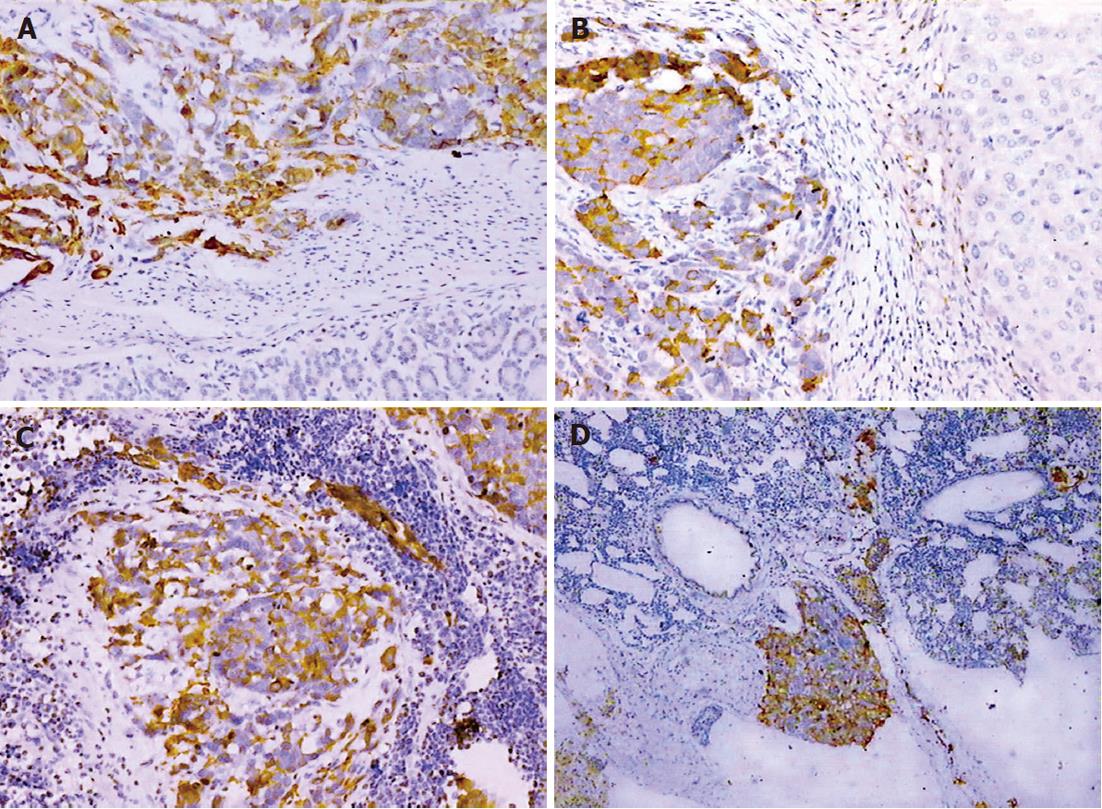
Figure 4 Immunohistochemistry of primary tumor and metastasis in the SGC-7901 model using the self-potential method.
Cytokeratin 20 (A: Stomach; B: Liver) and epithelial membrane antigen expression (C: Lymph node; D: Lung) shows as positive, characterized by the brown-yellow stain in the cytoplasm. Visualized by using DAB reagent; Magnification, × 100.
- Citation: Li Y, Li B, Xiang CP, Zhang Y, Li YY, Wu XL. Characterization of gastric cancer models from different cell lines orthotopically constructed using improved implantation techniques. World J Gastroenterol 2012; 18(2): 136-143
- URL: https://www.wjgnet.com/1007-9327/full/v18/i2/136.htm
- DOI: https://dx.doi.org/10.3748/wjg.v18.i2.136


