Copyright
©2012 Baishideng Publishing Group Co.
World J Gastroenterol. May 14, 2012; 18(18): 2180-2187
Published online May 14, 2012. doi: 10.3748/wjg.v18.i18.2180
Published online May 14, 2012. doi: 10.3748/wjg.v18.i18.2180
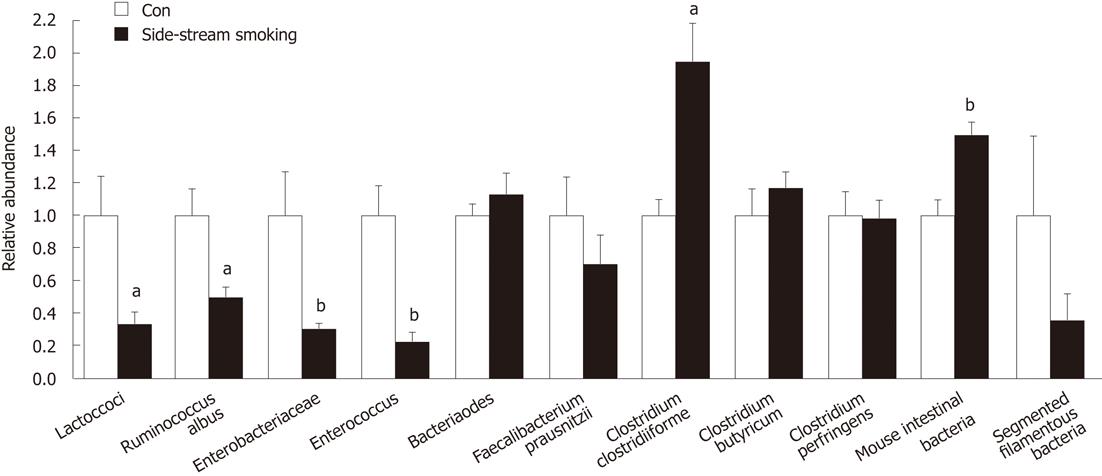
Figure 1 Cecal microflora composition of Con and side-stream smoking mice.
aP < 0.05, bP < 0.01 vs control group (mean ± SEM; n = 6 per group).
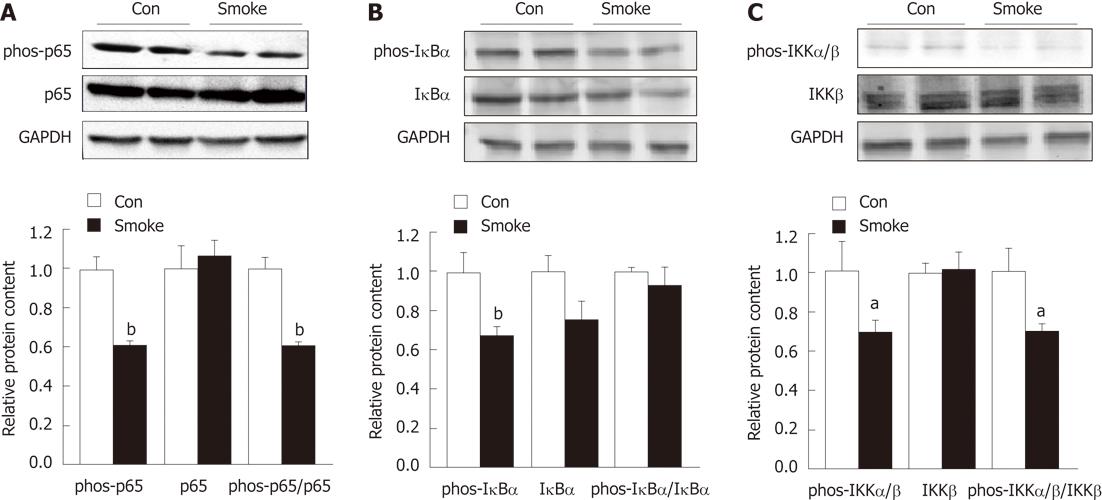
Figure 2 NF-κB signaling pathway in large intestine of Con and side-stream smoking mice.
A: Phos-p65 and p65; B: Phos-IκBa and IκBa; C: Phos-IKKα/β and IKKβ. aP < 0.05, bP < 0.01 vs control group (mean ± SEM; n = 6 per group).
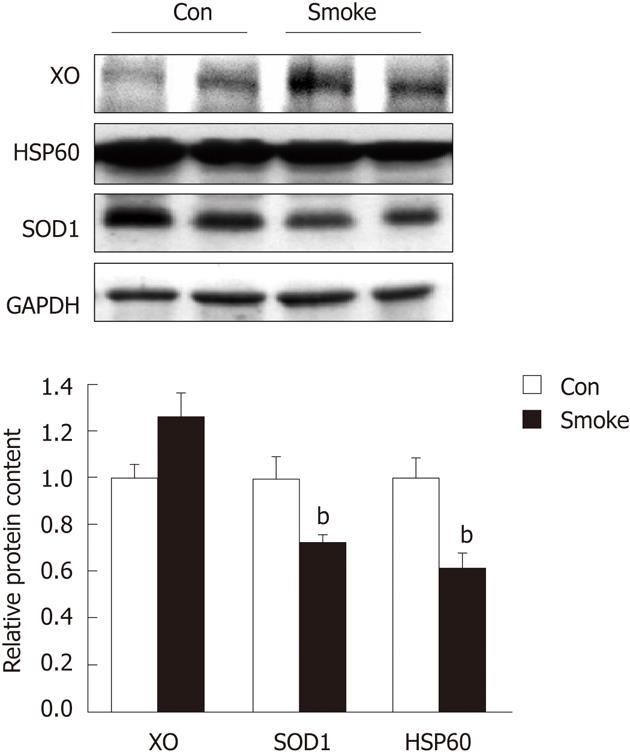
Figure 3 Xanthine oxidase, superoxide dismutase 1 and heat shock protein 60 content in large intestine of Con and side-stream smoking mice.
bP < 0.01 vs control group (mean ± SEM; n = 6 per group). XO: Xanthine oxidase; SOD1: Superoxide dismutase 1; HSP60: Heat shock protein 60.
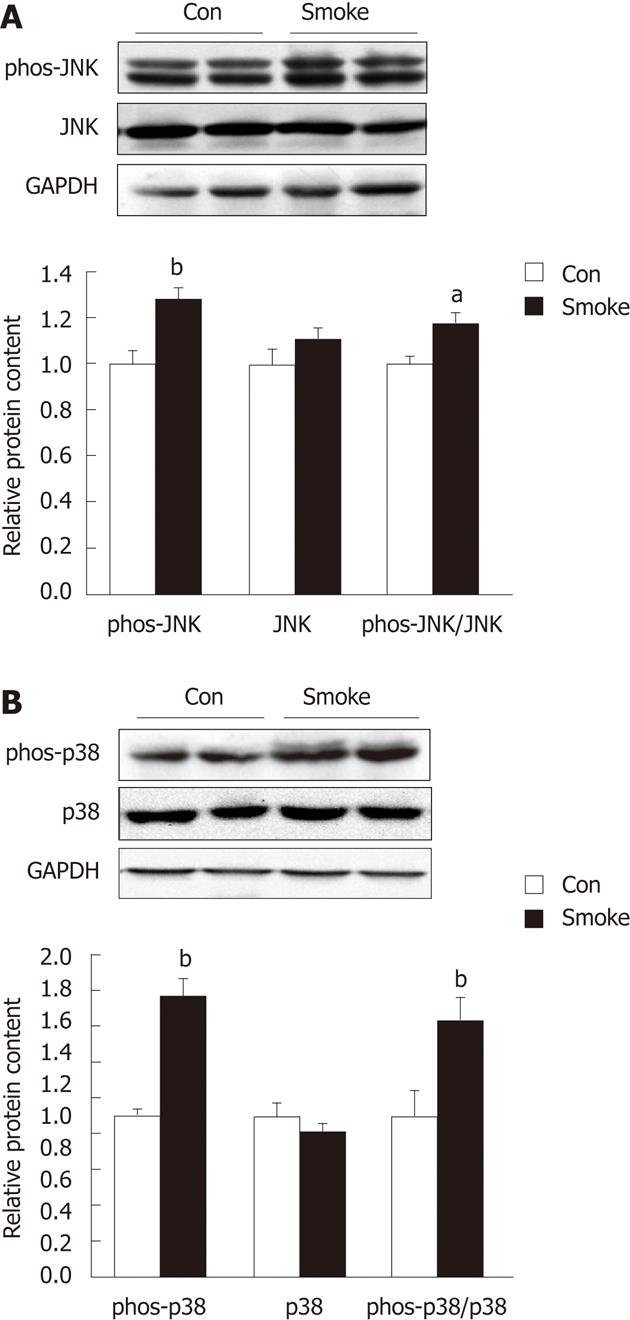
Figure 4 MAP kinase signaling pathways in large intestine of Con and side-stream smoking mice.
A: JNK; B: MAP kinase p38. aP < 0.05, bP < 0.01 vs control group (mean ± SEM; n = 6 per group).
Figure 5 Total AMP-activated protein kinase α subunit content and its phosphorylation at Thr 172 in large intestine of Con and side-stream smoking mice.
bP < 0.01 vs control group (mean ± SEM; n = 6 per group). AMPK: Total AMP-activated protein kinase.
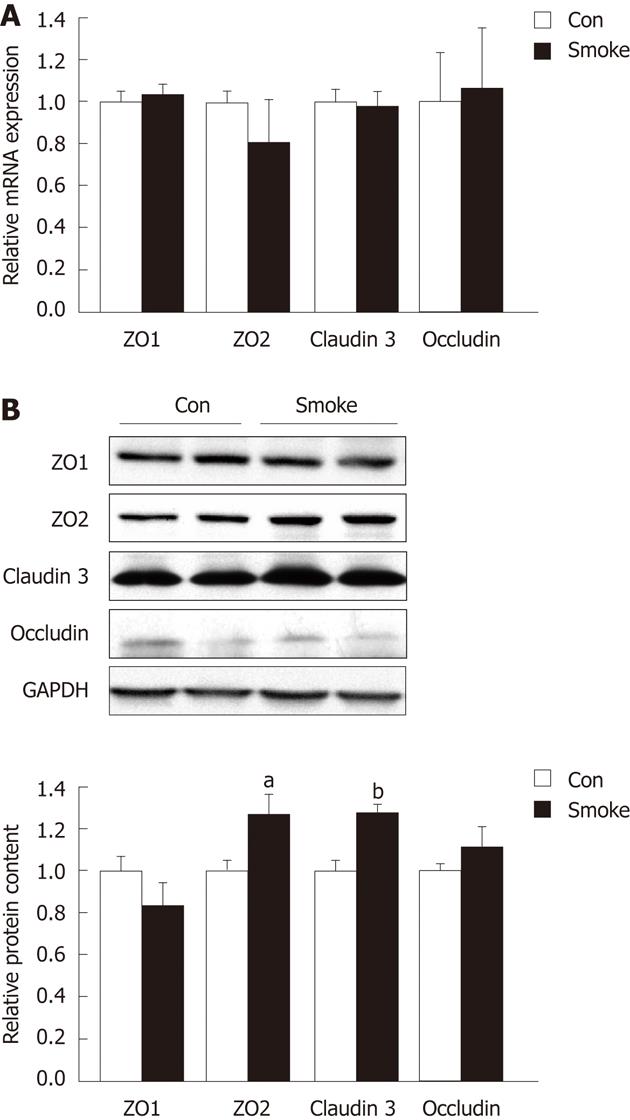
Figure 6 Tight junction protein content in large intestine of Con and side-stream smoking mice.
A: mRNA expression; B: Protein content. aP < 0.05, bP < 0.01 vs control group (mean ± SEM; n = 6 per group).
- Citation: Wang H, Zhao JX, Hu N, Ren J, Du M, Zhu MJ. Side-stream smoking reduces intestinal inflammation and increases expression of tight junction proteins. World J Gastroenterol 2012; 18(18): 2180-2187
- URL: https://www.wjgnet.com/1007-9327/full/v18/i18/2180.htm
- DOI: https://dx.doi.org/10.3748/wjg.v18.i18.2180


