Copyright
©2012 Baishideng Publishing Group Co.
World J Gastroenterol. Apr 28, 2012; 18(16): 1959-1967
Published online Apr 28, 2012. doi: 10.3748/wjg.v18.i16.1959
Published online Apr 28, 2012. doi: 10.3748/wjg.v18.i16.1959
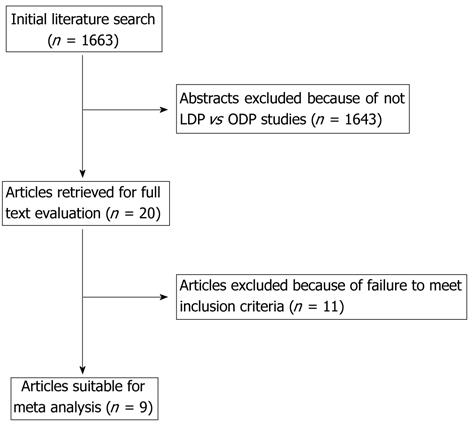
Figure 1 A flow chart of search strategies.
The initial search strategy retrieved 1663 papers in English. Finally 9 studies were included and extracted for detailed data. LDP: Laparoscopic distal pancreatectomy; ODP: Open distal pancreatectomy.
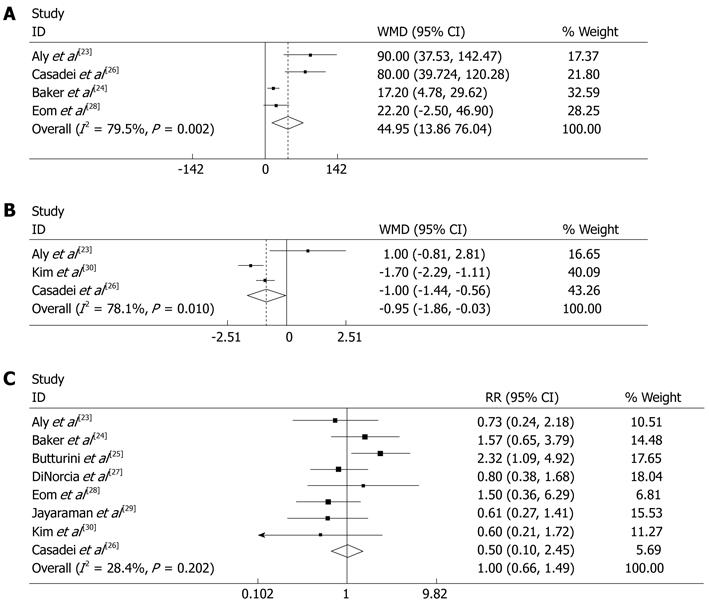
Figure 2 Meta-analysis of the pooled data.
A: operative time was significant ly shorter in open distal pancreatectomy (ODP) than in laparoscopic distal pancreatectomy (LDP) [random effects model, WMD 44.947 (13.857, 76.037), P = 0.005]; B: Time for fluid intake was shorter in LDP than in ODP [random effects model, WMD -0.948 (-1.863, 0.032), P = 0.042]; C: Pancreatic fistula occurrence has no significant difference between LDP and ODP [random effects model, RR 0.996 (0.663, 1.494), P = 0.983, I2 = 28.4%]. Weights are from random effects analysis. CI: Confidence interval; RR: Risk ratio; WMD: Weighted mean differences.
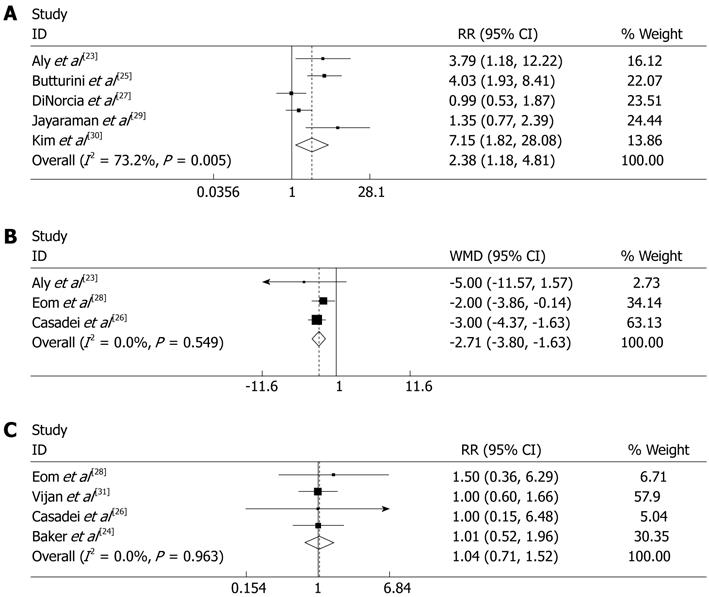
Figure 3 The pooled data.
A: The spleen-preserving rate of laparoscopic distal pancreatectomy (LDP) was significantly higher than open distal pancreatectomy (ODP) [random effects model, RR 2.380 (1.177, 4.812), P = 0.016, I2 = 73.2%]; B: Postoperative hospital stay was significantly shorter in LDP than in ODP [random effects model, WMD -2.713 (-3.799, 1.628), P = 0.00]; C: The proportion of malignant tumors showed no significant difference between LDP and ODP [fixed effects model, RR 1.036 (0.708, 1.516), P = 0.000, I2 = 0%]. Weights are from random effects analysis. CI: Confidence interval; RR: Risk ratio; WMD: Weighted mean differences.
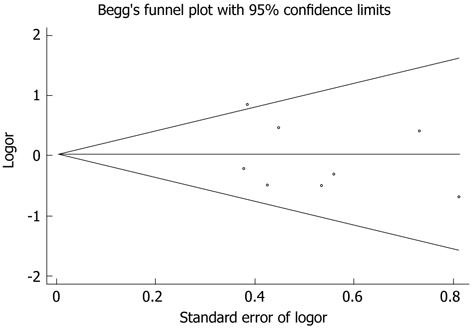
Figure 4 Begg’s test showing no publication bias of pancreatic fistula occurrence.
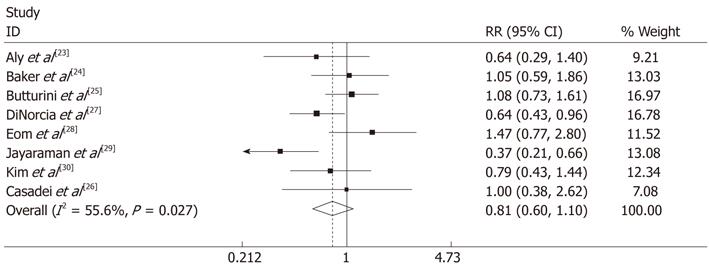
Figure 5 There was no significant difference in overall morbidity between laparoscopic distal pancreatectomy and open distal pancreatectomy [random effects model, risk ratio 0.
81 (0.596, 1.101), P = 0.178, I2 = 55.6%] and there was moderate heterogeneity. Weights are from random effects analysis. CI: Confidence interval; RR: Risk ratio.
- Citation: Xie K, Zhu YP, Xu XW, Chen K, Yan JF, Mou YP. Laparoscopic distal pancreatectomy is as safe and feasible as open procedure: A meta-analysis. World J Gastroenterol 2012; 18(16): 1959-1967
- URL: https://www.wjgnet.com/1007-9327/full/v18/i16/1959.htm
- DOI: https://dx.doi.org/10.3748/wjg.v18.i16.1959


