Copyright
©2012 Baishideng Publishing Group Co.
World J Gastroenterol. Apr 28, 2012; 18(16): 1884-1891
Published online Apr 28, 2012. doi: 10.3748/wjg.v18.i16.1884
Published online Apr 28, 2012. doi: 10.3748/wjg.v18.i16.1884
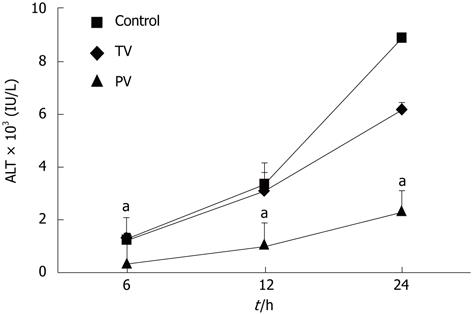
Figure 1 Effects of antithrombin III on serum alanine aminotransferase levels in rats with acute liver failure.
Lipopolysaccharide (LPS) and D-galactosamine (GalN) were injected intraperitoneally into 8-wk-old Wistar rats. One hour after the challenge, antithrombin (AT) III (50 U/kg body weight) was injected into the portal or tail vein. Serum alanine aminotransferase (ALT) levels were measured at 6 h, 12 h and 24 h after injection of LPS and GalN. Control: Untreated; TV: AT III injection via the tail vein; PV: AT III injection via the portal vein. Values are mean ± SD (n = 10 rats/group). aP < 0.01 vs the control group.
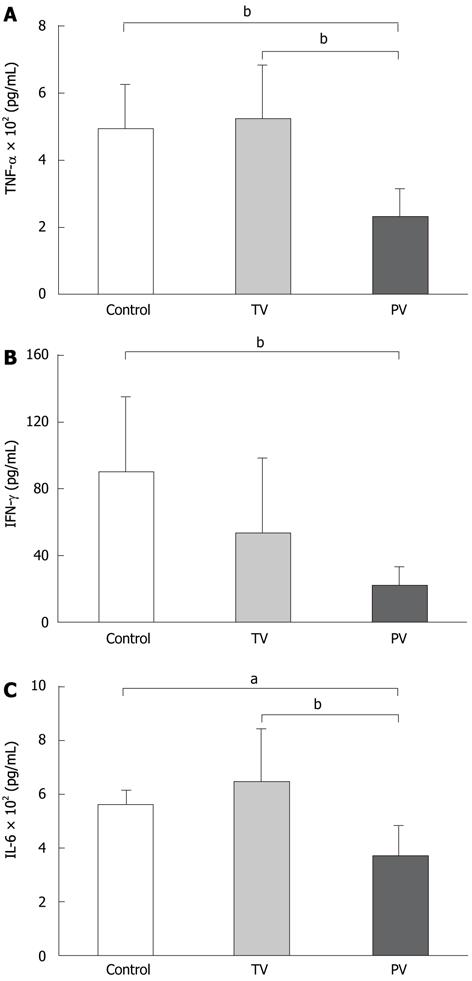
Figure 2 Effects of antithrombin III on serum inflammatory cytokine levels.
The serum levels of tumor necrosis factor-α (TNF-α) (A), interferon-γ (IFN-γ) (B) and interleukin (IL)-6 (C) were determined 24 h after injection of lipopolysaccharide and D-galactosamine. Control: Untreated; TV: Antithrombin (AT) III injection via the tail vein; PV: AT III injection via the portal vein. Values are means ± SD (n = 10 rats/group). aP < 0.05, bP < 0.01 vs control group.
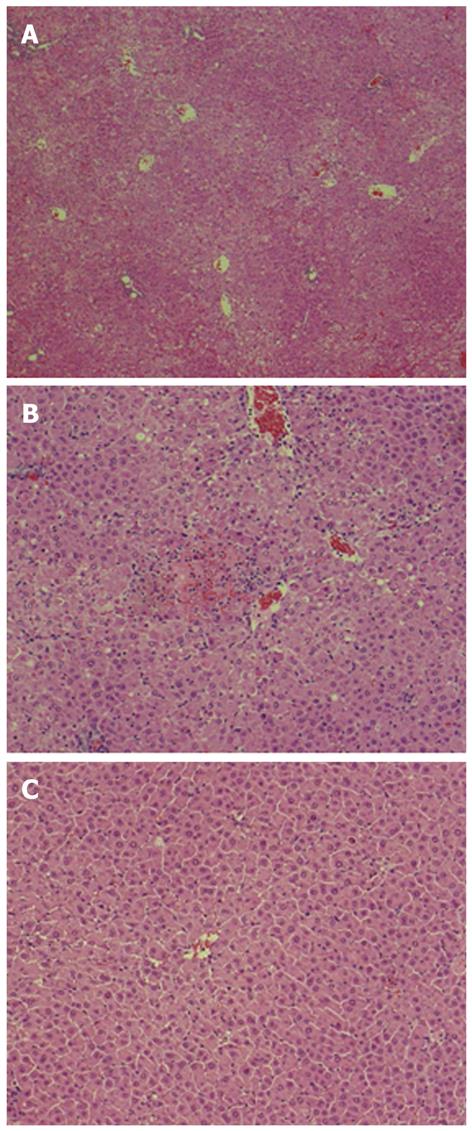
Figure 3 Effects of antithrombin III on liver histology.
Liver samples were obtained 24 h after lipopolysaccharide and D-galactosamine injection and stained with hematoxylin and eosin (magnification, × 200). A: Control; B: Antithrombin (AT) III injected via the tail vein; C: AT III injected via the portal vein.
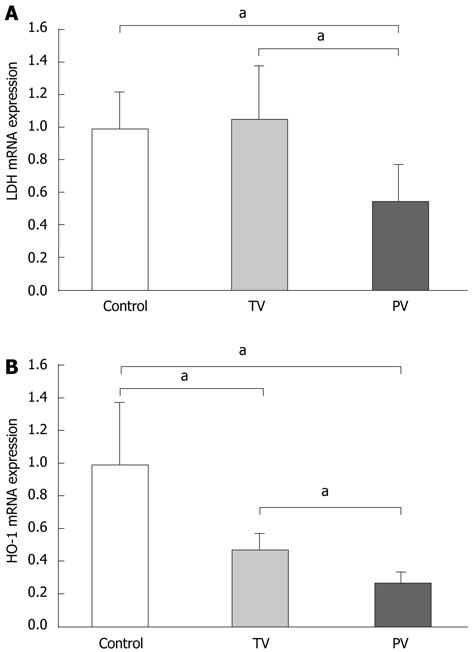
Figure 4 Effects of antithrombin III on hepatic mRNA expression of lactate dehydrogenase and heme oxygenase-1.
Hepatic mRNA expression of lactate dehydrogenase (LDH) (A) and heme oxygenase (HO)-1 (B) was determined by real-time polymerase chain reaction. Reactions were normalized for glyceraldehyde-3-phosphate dehydrogenase expression and the relative expression in the untreated liver was used as a control. Control: Untreated; TV: Antithrombin (AT) III injection via the tail vein; PV: AT III injection via the portal vein. Values are means ± SD (n = 10 rats/group). aP < 0.05 vs the tail vein group and the control group.
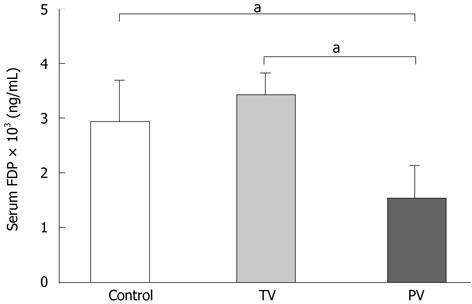
Figure 5 Effects of antithrombin III on serum fibrin degradation product levels.
The serum fibrin degradation product (FDP) levels were determined 24 h after injection of lipopolysaccharide and D-galactosamine. Control: Untreated; TV: Antithrombin (AT) III injection via the tail vein; PV: AT III injection via the portal vein. Values are means ± SD (n = 10 rats/group). aP < 0.05 vs control and tail vein groups.
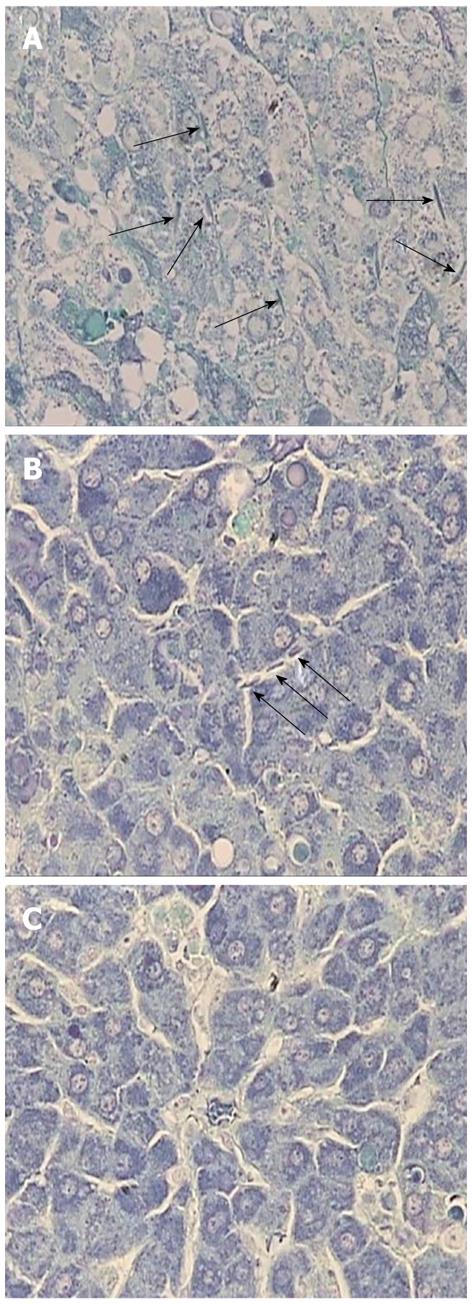
Figure 6 Effects of antithrombin III on hepatic phosphotungstic acid-hematoxylin staining.
To estimate the extent of intrasinusoidal coagulation, fibrin deposition was analyzed by phosphotungstic acid-hematoxylin staining (magnification, × 400). Fibrin deposition was observed as a dense rod-like structure (arrow). A: Control; B: Antithrombin (AT) III injected via the tail vein; C: AT III injected via the portal vein.
-
Citation: Miyazaki M, Kato M, Tanaka M, Tanaka K, Takao S, Kohjima M, Ito T, Enjoji M, Nakamuta M, Kotoh K, Takayanagi R. Antithrombin III injection
via the portal vein suppresses liver damage. World J Gastroenterol 2012; 18(16): 1884-1891 - URL: https://www.wjgnet.com/1007-9327/full/v18/i16/1884.htm
- DOI: https://dx.doi.org/10.3748/wjg.v18.i16.1884


