Copyright
©2012 Baishideng Publishing Group Co.
World J Gastroenterol. Apr 21, 2012; 18(15): 1834-1839
Published online Apr 21, 2012. doi: 10.3748/wjg.v18.i15.1834
Published online Apr 21, 2012. doi: 10.3748/wjg.v18.i15.1834
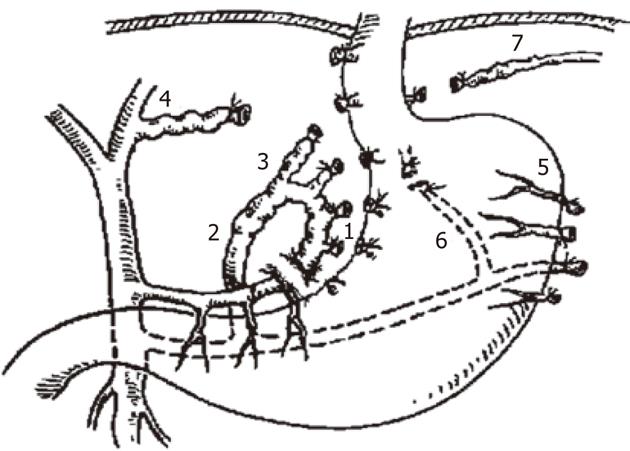
Figure 1 The anatomy of the lower part of the esophagus and periesophagogastric area after surgery.
1: Gastric branch of gastric coronary vein; 2: Esophageal branch of gastric coronary vein; 3: High esophageal branch of gastric coronary vein; 4: Aberrant high esophageal branch of gastric coronary vein; 5: Gastric short vein; 6: Gastric posterior vein; 7: Left subphrenic vein.
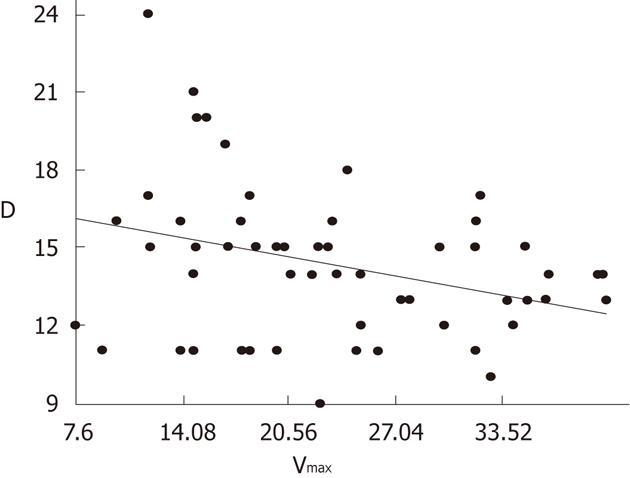
Figure 2 The diameter of the portal vein is negatively correlated with the preoperative maximum portal vein flow velocity.
Vmax: The mean maximum portal blood flow velocity; D: Portal vein diameter.
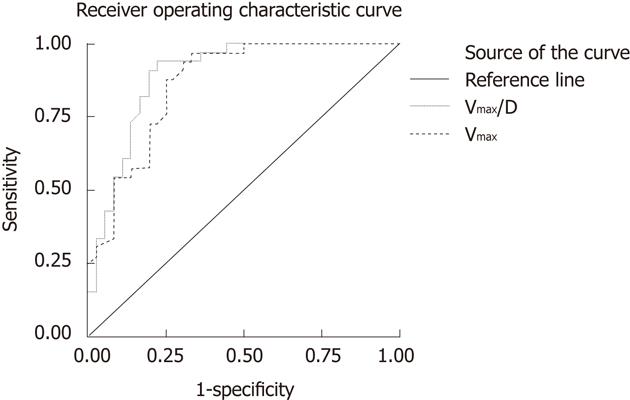
Figure 3 Receiver operating characteristic curve of the mean maximum portal blood flow velocity and Vmax/portal vein diameter.
Vmax: The mean maximum portal blood flow velocity; D: Portal vein diameter.
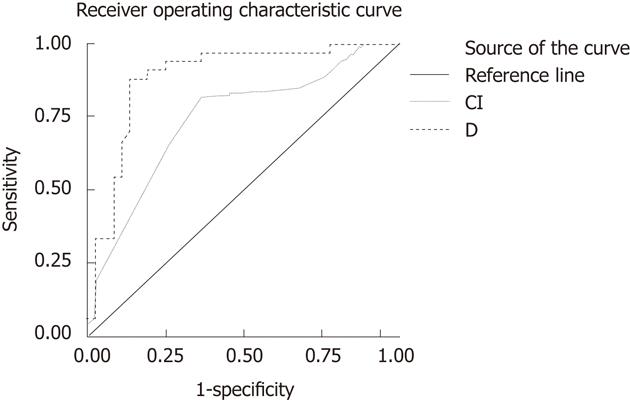
Figure 4 Receiver operating characteristic curve of hepatic congestion index and portal vein diameter.
CI: Congestion index; D: Portal vein diameter.
- Citation: Zhang Y, Wen TF, Yan LN, Yang HJ, Deng XF, Li C, Wang C, Liang GL. Preoperative predictors of portal vein thrombosis after splenectomy with periesophagogastric devascularization. World J Gastroenterol 2012; 18(15): 1834-1839
- URL: https://www.wjgnet.com/1007-9327/full/v18/i15/1834.htm
- DOI: https://dx.doi.org/10.3748/wjg.v18.i15.1834


