Copyright
©2012 Baishideng Publishing Group Co.
World J Gastroenterol. Apr 21, 2012; 18(15): 1781-1788
Published online Apr 21, 2012. doi: 10.3748/wjg.v18.i15.1781
Published online Apr 21, 2012. doi: 10.3748/wjg.v18.i15.1781
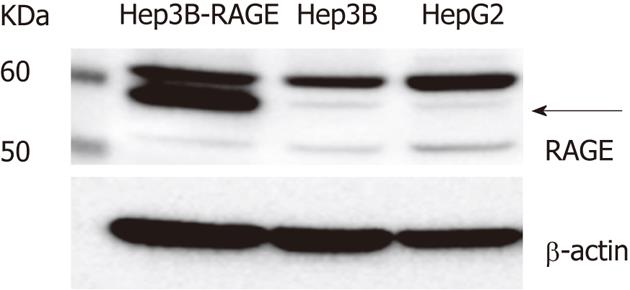
Figure 1 The receptor for advanced glycation end-products expression in hepatocellular carcinoma cells.
The receptor for advanced glycation end-products (RAGE) expression as measured by Western blotting. Cell lysates (30 μg of proteins/lane) were loaded onto a 10% polyacrylamide gel. Size markers (kDa) are shown on the left. Equal protein loading was verified using an anti-β-actin antibody. The arrow indicates full-length RAGE.
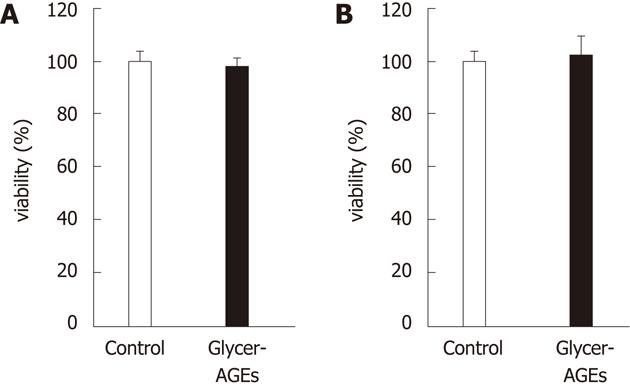
Figure 2 Effect of glyceraldehyde-derived advanced glycation end-products on the viability of hepatocellular carcinoma cells.
Cell viability was determined using the WST-8 assay. Hep3B (A) and HepG2 (B) cells were incubated with control unglycated bovine serum albumin (BSA) or glyceraldehyde-derived advanced glycation end-products (Glycer-AGEs) (100 μg/mL) for 24 h. The open and filled bars represent results for cells treated with control unglycated BSA and Glycer-AGEs, respectively. Data are shown as the mean ± SD (n = 6).
Figure 3 Effect of glyceraldehyde-derived advanced glycation end-products on the malignancy of hepatocellular carcinoma cells.
Hep3B and HepG2 cells were incubated with control unglycated bovine serum albumin (BSA) or glyceraldehyde-derived advanced glycation end-products (Glycer-AGEs) for 24 h. A: In Hep3B cells, cyclooxygenase-2 (COX-2) mRNA expression levels were analyzed using real-time reverse transcription-polymerase chain reactions, and results were normalized to the β-actin mRNA level (n = 3), bP < 0.01 vs control unglycated BSA; B: COX-2 expression as measured by Western blotting. Cell lysates (30 μg of proteins/lane) were loaded onto a 10% polyacrylamide gel. Size markers (kDa) are shown on the left. Equal protein loading was verified using an anti-β-actin antibody. As a positive control, A549 cells were incubated with phorbol 12-myristate 13-acetate (PMA: 100 nmol/L) for 6 h; C: The migratory capacity of Hep3B cells was evaluated using the Oris cell migration assay (n = 8). Cells were incubated with control unglycated BSA or Glycer-AGEs for 24 h, and the number of migrating cells was then assessed using a fluorescence microplate reader. RFU: Relative fluorescence units. The open and filled bars represent results for cells treated with control unglycated BSA and Glycer-AGEs, respectively. Data are shown as the mean ± SD.
Figure 4 Effect of glyceraldehyde-derived advanced glycation end-products on the angiogenesis of hepatocellular carcinoma cells.
A and B: Hep3B and HepG2 cells were incubated with control unglycated bovine serum albumin (BSA) or glyceraldehyde-derived advanced glycation end-products (Glycer-AGEs) for 24 h. Vascular endothelial growth factor (VEGF) mRNA expression was analyzed using real-time reverse transcription-polymerase chain reactions, and results were normalized to the β-actin mRNA level; C and D: Hep3B and HepG2 cells were incubated with control unglycated BSA or Glycer-AGEs for 24 or 48 h. The conditioned medium was collected, and VEGF expression levels of the cells were determined by enzyme-linked immunosorbent assay. The open and filled bars represent results for cells treated with control unglycated BSA and Glycer-AGEs, respectively. Data are shown as the mean ± SD (n = 3), bP < 0.01 vs control unglycated BSA.
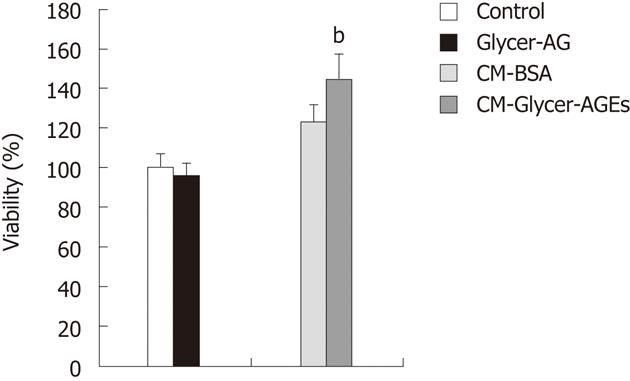
Figure 5 Effect of glyceraldehyde-derived advanced glycation end-products-treated CM on human umbilical vein endothelial cells proliferation.
Cell viability was determined with the WST-8 assay. Human umbilical vein endothelial cells were incubated with control unglycated bovine serum albumin (BSA), glyceraldehyde-derived advanced glycation end-products (Glycer-AGEs) (100 μg/mL), CM-BSA, or CM-Glycer-AGEs for 72 h. The open and filled bars represent results for cells treated with control unglycated BSA and Glycer-AGEs, respectively, and the light grey and the black grey bars represent results for cells treated with CM-BSA and CM-Glycer-AGEs, respectively. Data are shown as the mean ± SD (n = 6), bP < 0.01 vs CM-BSA.
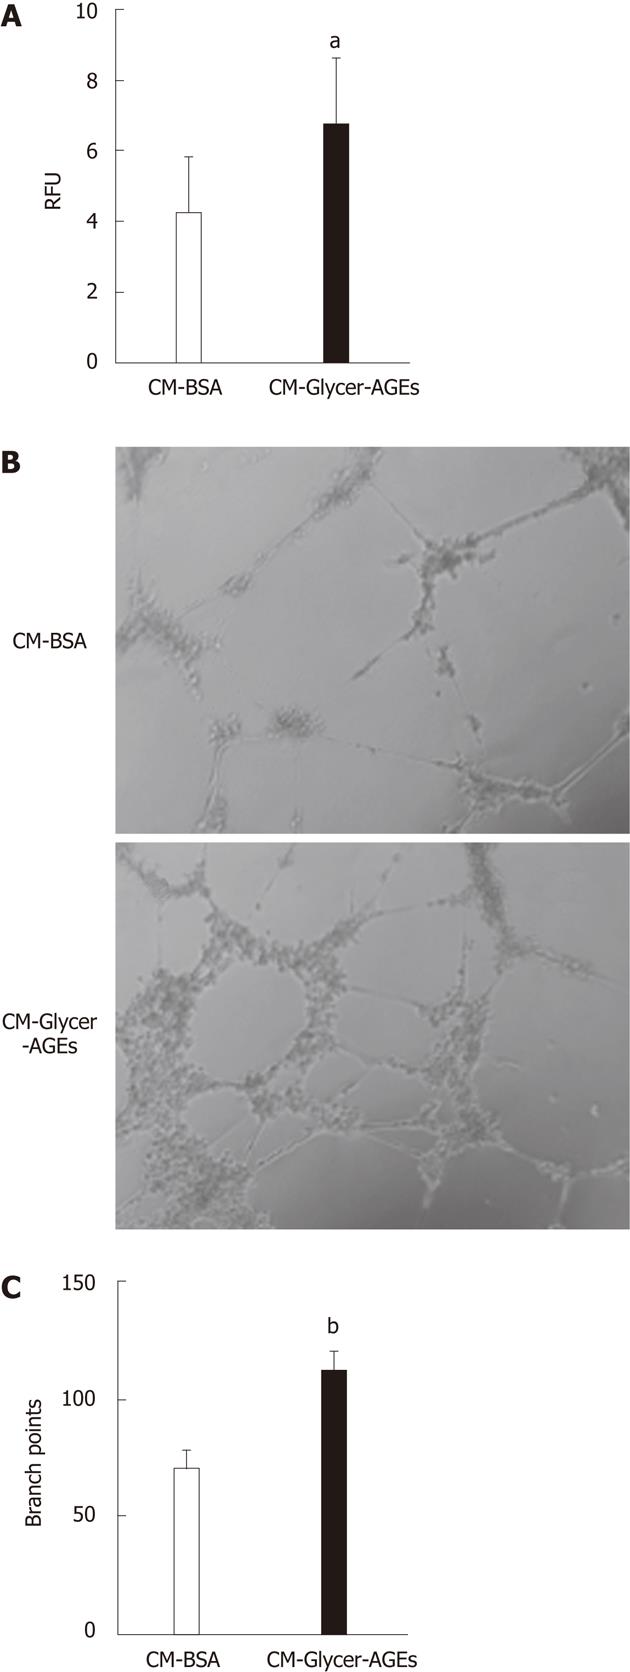
Figure 6 Effect of glyceraldehyde-derived advanced glycation end-products-treated CM on human umbilical vein endothelial cells angiogenesis.
A: The migratory capacity of human umbilical vein endothelial cells (HUVEC) was evaluated using the endothelial cell migration assay. Cells were incubated with CM-bovine serum albumin (BSA) or glyceraldehyde-derived advanced glycation end-products-treated CM (CM-Glycer-AGEs) for 22 h, and the number of migrating cells was assessed using a fluorescence microplate reader. RFU: relative fluorescence units (n = 8); B and C: The tube formation of HUVEC was evaluated using the endothelial cell tube formation assay (n = 5). Cells were incubated with CM-BSA or CM-Glycer-AGEs for 12 h and then photographed under a microscope (B); the number of branch points was counted (C). Magnification = 100 ×. The open and filled bars represent results for cells treated with CM-BSA and CM-Glycer-AGEs, respectively. Data are shown as the mean ± SD, aP < 0.05, bP < 0.01 vs CM-BSA.
- Citation: Takino J, Yamagishi S, Takeuchi M. Glycer-AGEs-RAGE signaling enhances the angiogenic potential of hepatocellular carcinoma by upregulating VEGF expression. World J Gastroenterol 2012; 18(15): 1781-1788
- URL: https://www.wjgnet.com/1007-9327/full/v18/i15/1781.htm
- DOI: https://dx.doi.org/10.3748/wjg.v18.i15.1781


