Copyright
©2012 Baishideng Publishing Group Co.
World J Gastroenterol. Jan 7, 2012; 18(1): 70-78
Published online Jan 7, 2012. doi: 10.3748/wjg.v18.i1.70
Published online Jan 7, 2012. doi: 10.3748/wjg.v18.i1.70
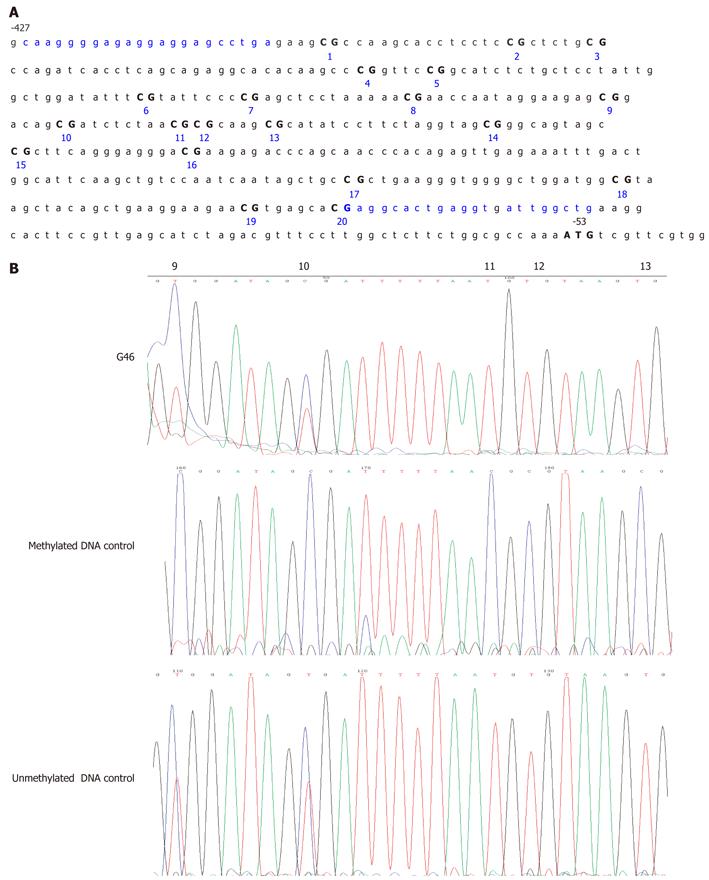
Figure 1 Germline MLH1 promoter hypermethylation analysis in a gastric cancer patient cohort.
A: Map of the CpG island structure in the MLH1 promoter. The sequence is numbered relative to the translation start site for human MLH1 (bolded “ATG” ). Characters in blue indicate the primer binding sites for bisulfite sequencing. Individual CpG sites in the sequence are numbered consecutively; B: Bisulfite sequencing of MLH1 promoter sequences. G46, DNA isolated from the blood of case G46 showing a mixture of C and T at the 6th to 20th CpG sites attributable to partial modification of the DNA due to partial methylation; Methylated DNA control, CpGenome Universal Methylated DNA in which MLH1 is completely methylated showing a high C content at all CpGs attributable to reduced modification because of complete methylation of the DNA; Unmethylated DNA control, CpGenome Universal Unmethylated DNA showing T bases at all CpGs except the 9th and 10th CpG sites due to almost complete modification of the DNA. The 9th and 10th CpG sites show a high number of Cs in G46, but also in the unmethylated control, suggesting that these sites are uninformative in relation to gastric cancer.
Figure 2 Clonal bisulfite allelic sequencing of the MLH1 promoter in the peripheral blood from gastric cancer patient G46.
A: Each horizontal line of circles represents an isolated allele. The numbering scheme is derived from the map shown in Figure 1A. White circles represent non-methylated CpG sites, and black circles indicate a methylated CpG. This subject displayed 10% methylated alleles at the 6th to 20th CpG sites, suggestive of mosaic allele-specific germline epimutation. Green, -93A; Red, -93G; B: Upper figure, sequencing of clone 5 from case G46 showing methylation at the 6th to 20th CpG sites. Lower figure, sequencing of G46 clone 7 revealing unmethylated CpGs except for the 9th and 10th CpG sites. The numbers above the sequences are derived from the map shown in Figure 1A, indicating the location of the CpG sites.
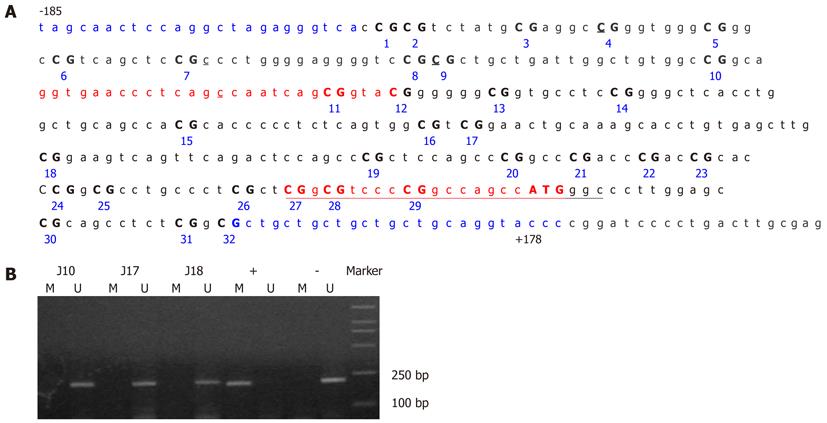
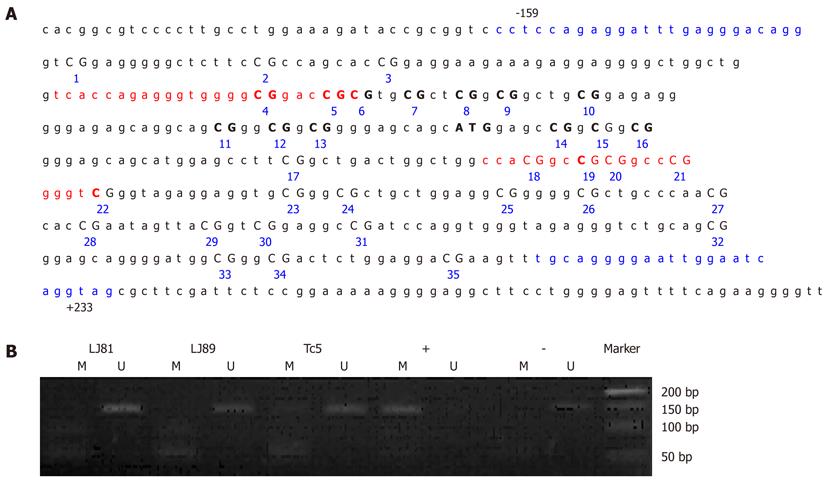
Figure 3 Germline CDH1 promoter hypermethylation analysis in GC patients.
A: Map of the CDH1 promoter region and primer positions. The sequence is numbered relative to the transcription start site for human CDH1. Characters in red indicate the primer binding sites for methylation-specific PCR (MSP), those in blue for bisulfite sequencing. Individual CpG sites in the sequence are numbered consecutively; B: MSP of the CDH1 promoter from the peripheral blood of GC patients. Marker, DL2000 DNA Markers (TaKaRa); +, CpGenome Universal Methylated DNA control; -, CpGenome Universal Unmethylated DNA control; M, methylated band; U, unmethylated band. As a control, the fragments corresponding to the CDH1 promoter of fully methylated DNA showed a clear band when amplified with methylated-specific primers and did not display a band when treated with unmethylated primers. The unmethylated DNA control showed the reverse pattern.
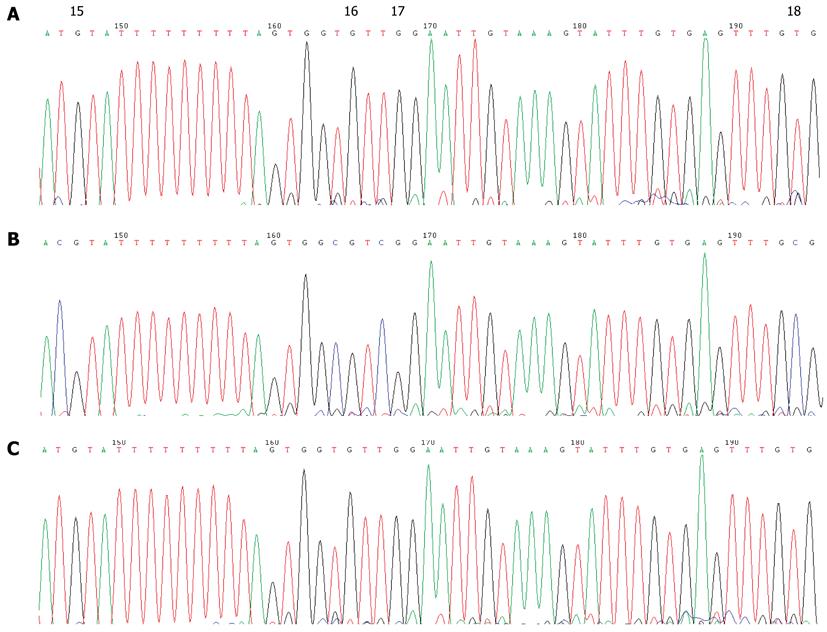
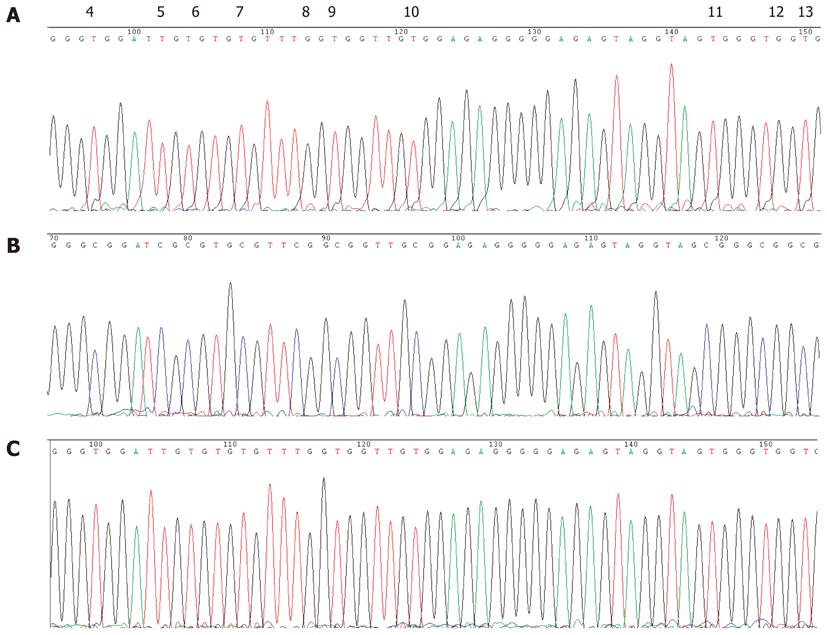
Figure 4 Bisulfite sequencing of CDH1 promoter sequences from gastric cancer patients.
A: DNA isolated from the blood of a gastric cancer patient showing T bases at the CpG sites around the transcription start site due to complete modification of the DNA; B: CpGenome Universal Methylated DNA control in which CDH1 is completely methylated showing a high level of C at all CpGs due to reduced bisulfite modification; C: CpGenome Universal Unmethylated DNA control showing T bases at the CpG sites around the transcription start site attributable to complete bisulfite modification of the DNA.
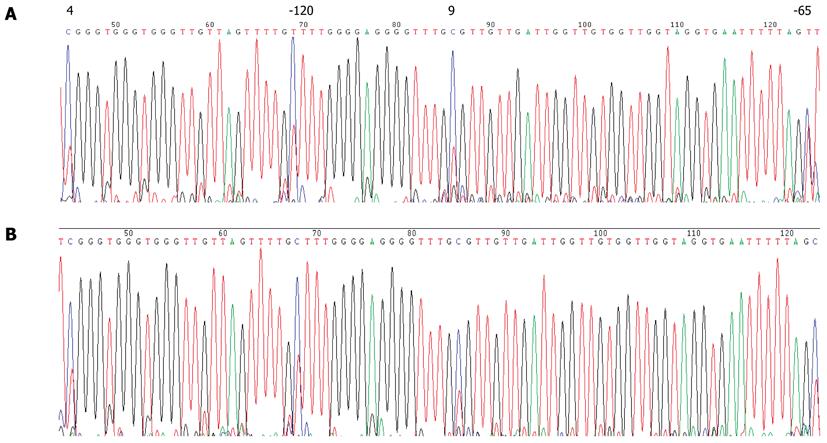
Figure 5 Bisulfite sequencing of the CDH1 promoter sequences from gastric cancer patients showing uninformative CpG sites.
A: DNA isolated from the blood of a gastric cancer (GC) patient; B: DNA isolated from the blood of a normal control. The 4th and 9th CpG sites showed a high C content in all patients, but also in each of the normal controls, suggesting that these sites are not associated with GC.
Figure 6 Analysis of the methylation pattern of the P16 gene in blood cells from gastric cancer patients.
A: Map of the P16 promoter region and positions of the primers used in the analysis. The sequence is numbered relative to the translation start site for human P16. Characters in red indicate the primer binding sites for MSP and those in blue for bisulfite sequencing. Individual CpG sites are numbered consecutively; B: MSP of the P16 promoter in peripheral blood from patients with gastric cancer. Marker, DL500 DNA Marker (TaKaRa); +, fully methylated DNA control; -, fully unmethylated DNA control; M, methylated band; U, unmethylated band. As a control, the fragments corresponding to the P16 promoter of fully methylated DNA showed a clear band when amplified with methylated-specific primers and did not display a band when treated with unmethylated primers. The fully unmethylated DNA control showed the reverse pattern.
Figure 7 Bisulfite sequencing of P16 promoter sequences.
A: DNA isolated from the blood of a GC patient showing a T at all CpG sites of the P16 gene promoter region due to complete modification of the DNA; B: CpGenome Universal Methylated DNA control in which a high C content can be found at all CpGs in the P16 gene; C: CpGenome Universal Unmethylated DNA control showing a T at all CpG sites in the P16 gene promoter.
- Citation: Wu PY, Zhang Z, Wang JM, Guo WW, Xiao N, He Q, Wang YP, Fan YM. Germline promoter hypermethylation of tumor suppressor genes in gastric cancer. World J Gastroenterol 2012; 18(1): 70-78
- URL: https://www.wjgnet.com/1007-9327/full/v18/i1/70.htm
- DOI: https://dx.doi.org/10.3748/wjg.v18.i1.70


