Copyright
©2011 Baishideng Publishing Group Co.
World J Gastroenterol. Mar 7, 2011; 17(9): 1192-1198
Published online Mar 7, 2011. doi: 10.3748/wjg.v17.i9.1192
Published online Mar 7, 2011. doi: 10.3748/wjg.v17.i9.1192
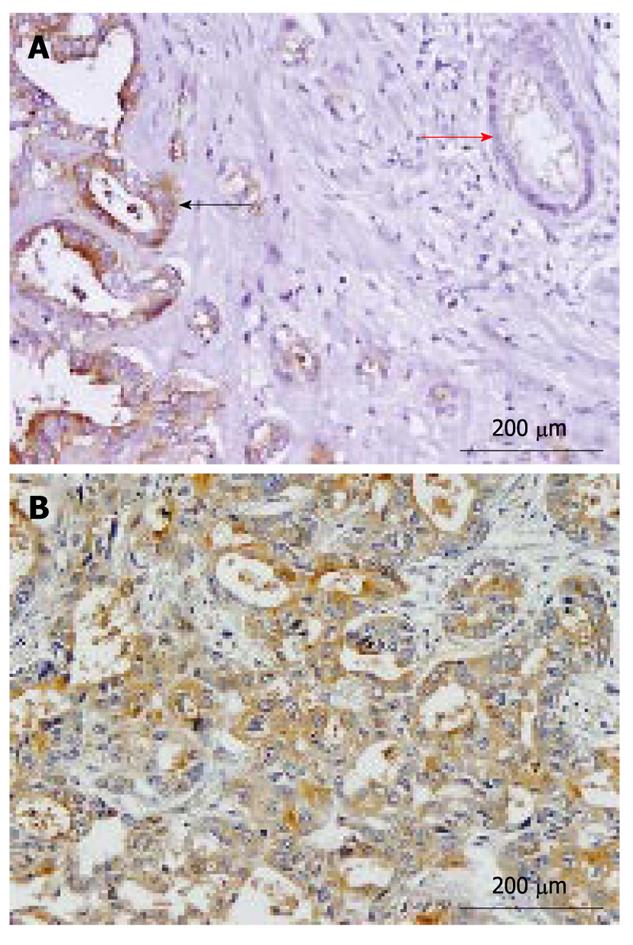
Figure 1 Representative immunohistochemical staining for CD133 in cholangiocarcinoma specimens.
A: Normal bile duct cells (red arrow) demonstrated negative staining, whereas cholangiocarcinoma cells had strong cytoplasmic staining (black arrow); B: Moderately differentiated cholangiocarcinoma with overexpression of CD133. Positive staining was observed in the cytoplasm of cholangiocarcinoma cells (200 × magnification).
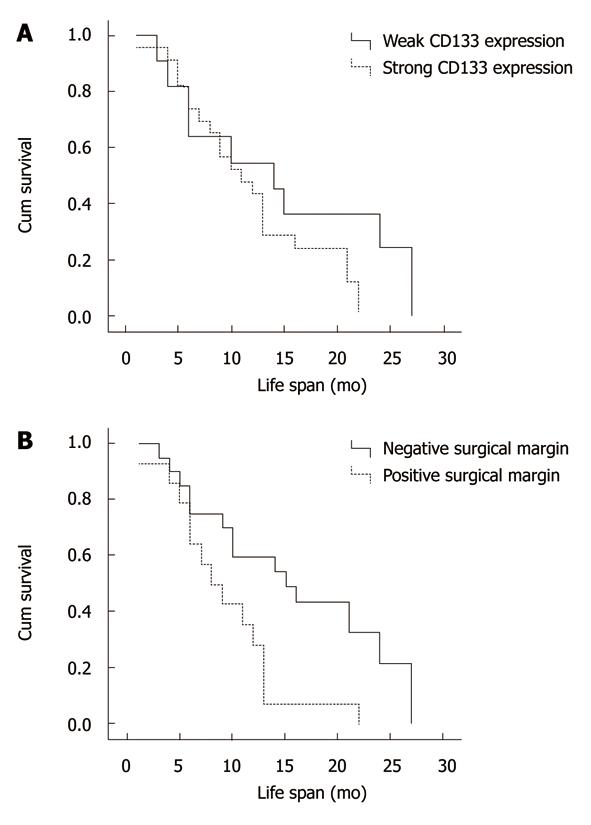
Figure 2 Kaplan-Meier cumulative overall survival curves.
A: Survival curves of patients with strong and weak CD133 expression (P = 0.23); B: Survival curves of patients with positive and negative surgical margin status (P = 0.009).
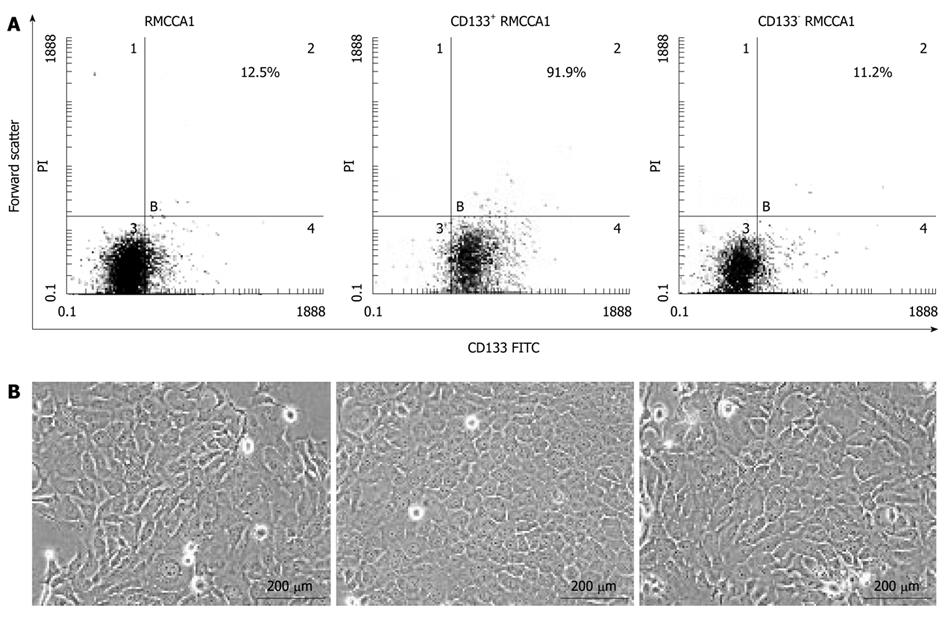
Figure 3 Isolation of CD133+ and CD133- cholangiocarcinoma cells.
A: The percentage of CD133-expressing cells in the original RMCCA1 cell populations, the flushed-out fractions (CD133+ RMCCA1 cells) and the flow-through (CD133- RMCCA1 cells) were analyzed by fluorescence-activated cell sorting; B: The morphology of original, CD133+ and CD133- RMCCA1 cells is demonstrated under a phase contrast microscope at 200 × magnification. FITC: Fluorescein isothiocyanate.
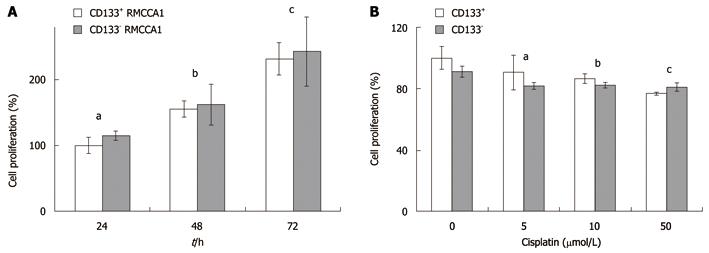
Figure 4 Cell proliferation assays of CD133+ and CD133- RMCCA1 cells.
A: The proliferation rates of CD133+ and CD133- cholangiocarcinoma cells. CD133+ and CD133- RMCCA1 cells were cultured for 24-72 h. A cell proliferation assay was performed using WST-1. Results are reported as a percentage of cell proliferation, where the optical density values from CD133+ cells cultured for 24 h are set as 100% of proliferation. Data is represented as the mean ± SD of 3 independent experiments. (aP = 0.095, bP = 0.578, cP = 0.544 vs the same time of culturing); B: Effect of cisplatin on cholangiocarcinoma cells. CD133+ and CD133- RMCCA1 cells were treated with cisplatin at various concentrations (0, 5, 10 and 50 μmol/L) for 2 d. Effects on cell proliferation were measured by WST-1. Results are reported as percentage of cell proliferation, where the optical density values from vehicle-treated cells (0 μmol/L cisplatin) are set as 100% proliferation. Data is presented as the mean ± SD of 3 independent experiments. (aP = 0.060, bP = 0.056, cP = 0.053 vs the same concentration of cisplatin). WST: Water soluble tetrazolium salts.
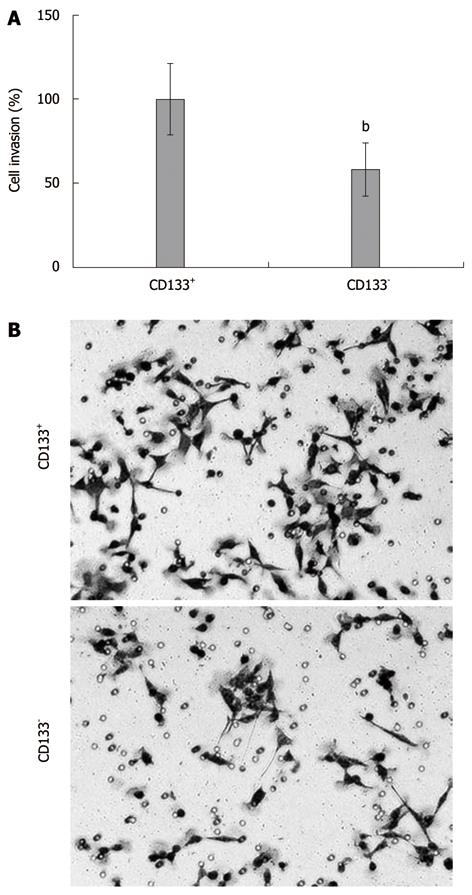
Figure 5 Invasion assays of CD133+ and CD133- RMCCA1 cells.
A: Invasion assays of CD133+ and CD133- RMCCA1 cells were performed using the Biocoat Matrigel invasion chamber. Results are reported as the percentage of cell invasion, where the number of cell invasion from CD133+ RMCCA1 cells is set as 100% cell invasion. Data is represented as the mean ± SD of three independent experiments (bP < 0.001); B: The morphology of CD133+ and CD133- RMCCA1 cell invasion is demonstrated under a phase contrast microscope at 200 × magnification.
- Citation: Leelawat K, Thongtawee T, Narong S, Subwongcharoen S, Treepongkaruna SA. Strong expression of CD133 is associated with increased cholangiocarcinoma progression. World J Gastroenterol 2011; 17(9): 1192-1198
- URL: https://www.wjgnet.com/1007-9327/full/v17/i9/1192.htm
- DOI: https://dx.doi.org/10.3748/wjg.v17.i9.1192


