Copyright
©2011 Baishideng Publishing Group Co.
World J Gastroenterol. Mar 7, 2011; 17(9): 1126-1134
Published online Mar 7, 2011. doi: 10.3748/wjg.v17.i9.1126
Published online Mar 7, 2011. doi: 10.3748/wjg.v17.i9.1126
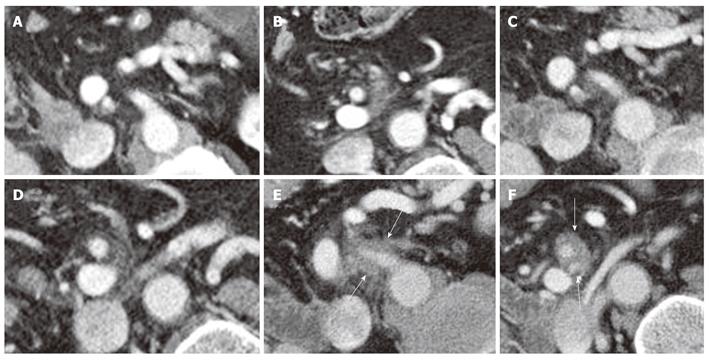
Figure 1 Computed tomography follow-up after Whipple’s procedure for pancreatic cancer of the head in a 69-year-old patient (T3, N1).
A, B: Follow-up imaging after 3 mo; C, D: 11 mo; E, F: 22 mo. Recurrence at the origin of the superior mesenteric artery (E) and more distally in the mesenteric root (F: white arrows).
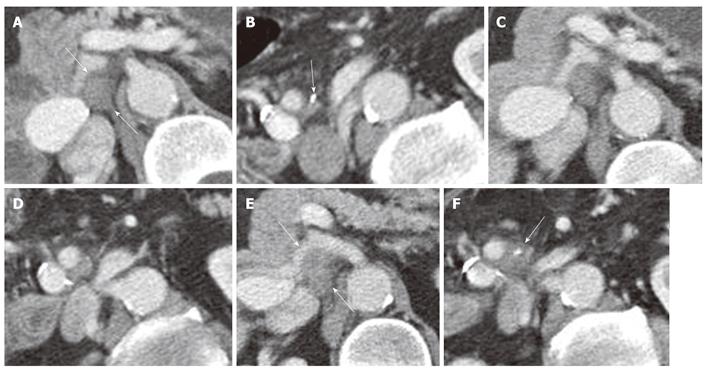
Figure 2 Sixty-eight-year-old patient after surgery for ductal adenocarcinoma of the pancreatic head (T3, N1).
A, B: Follow-up imaging after 6 mo; C, D: 8 mo; E, F: 12 mo. Initial soft tissue formation (A, B: white arrows) with a carbohydrate antigen 19-9 (CA19-9) level of 9 U/mL increased (E, F: white arrows) with concurrent increase in CA 19-9 to 56 U/mL.
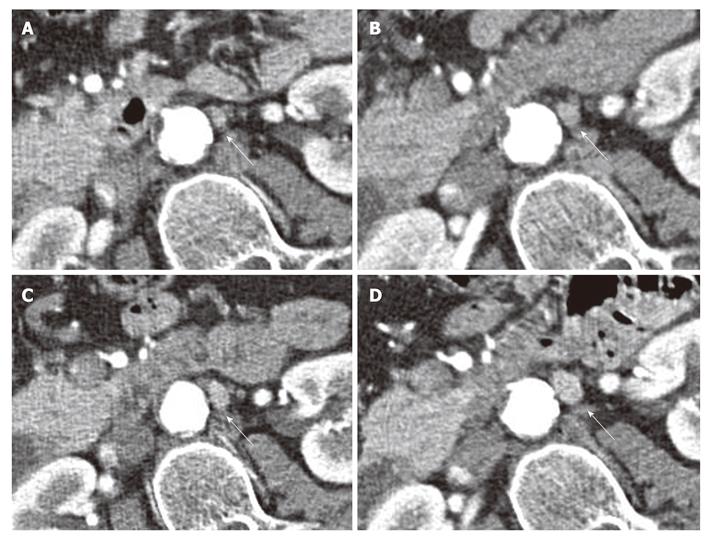
Figure 3 Sixty-year-old patient after resection of the pancreatic tail for a neuroendocrine carcinoma.
Follow-up imaging after A : 4 mo; B: 7 mo; C: 9 mo; D: 12 mo. A normal size lymph node( white arrows) of 9 mm initially at the left of the aorta (A) increased to 16 mm (D) indicating lymph node recurrence.
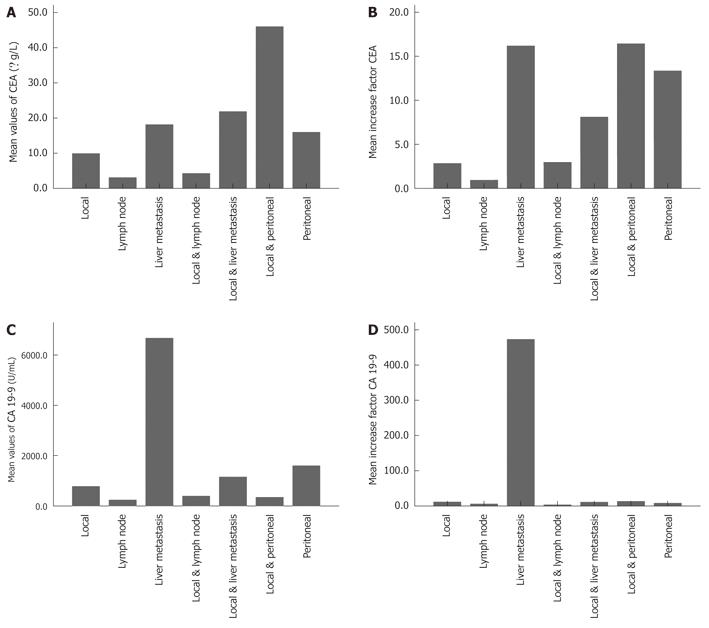
Figure 4 Bar graphs of mean values and mean increase factors for carcinoembryonic antigen and carbohydrate antigen 19-9 stratified by type of recurrence.
A: Mean values of carcinoembryonic antigen (CEA) (μg/L) at the time of recurrence stratified by type of recurrence; B: Mean increase factor of CEA (μg/L) (values at the time of recurrence divided by initial values) stratified by type of recurrence; C: Mean values of carbohydrate antigen 19-9 (CA19-9) (U/mL) at the time of recurrence stratified by type of recurrence; D: Mean increase factor of CA 19-9 (U/mL) (values at the time of recurrence divided by initial values) stratified by type of recurrence.
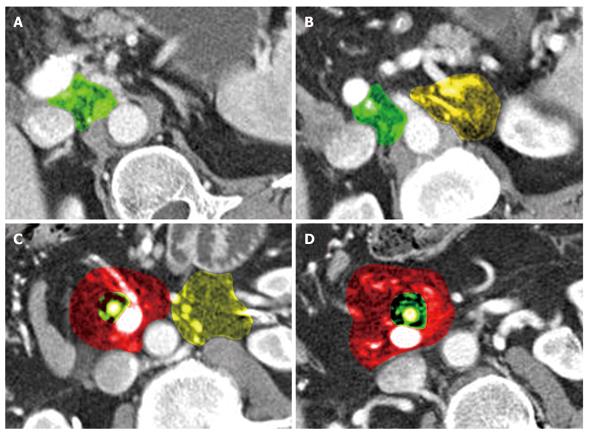
Figure 5 Schematic summary of localizations of local and lymph node recurrence patterns on contrast enhanced computed tomography at different levels of the upper abdomen.
A: Offspring celiac trunk; B: Offspring superior mesenteric artery; C: Middle part of mesenteric root; D: Distal mesenteric root. Light green: Local recurrence in the area limited by cT (celiac trunk), (portal vein) PV, (inferior vena cava) IVC (top left); light green: Local recurrence in the area limited by superior mesenteric artery (SMA), PV, IVC (top right); yellow: Lymph node recurrence to the left of the aorta above/below the level of the renal vein; dark green: Local recurrence along the SMA; red: Lymph node recurrence in the mesenteric root close to the SMA.
- Citation: Heye T, Zausig N, Klauss M, Singer R, Werner J, Richter GM, Kauczor HU, Grenacher L. CT diagnosis of recurrence after pancreatic cancer: Is there a pattern? World J Gastroenterol 2011; 17(9): 1126-1134
- URL: https://www.wjgnet.com/1007-9327/full/v17/i9/1126.htm
- DOI: https://dx.doi.org/10.3748/wjg.v17.i9.1126


