Copyright
©2011 Baishideng Publishing Group Co.
World J Gastroenterol. Feb 28, 2011; 17(8): 996-1003
Published online Feb 28, 2011. doi: 10.3748/wjg.v17.i8.996
Published online Feb 28, 2011. doi: 10.3748/wjg.v17.i8.996
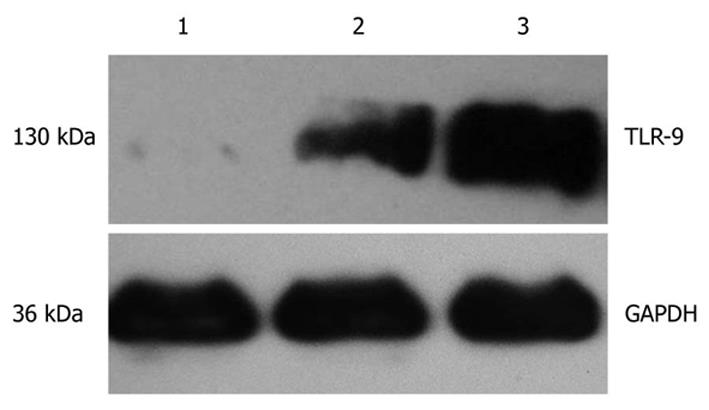
Figure 1 Western blotting test for toll-like receptor 9 protein.
1: Normal human pancreatic tissue; 2: Human peritumoral tissue; 3: Human pancreatic cancer tissue. TLR-9: Toll-like receptor 9; GAPDH: Glyceraldehyde-3-phosphate dehydrogenase.
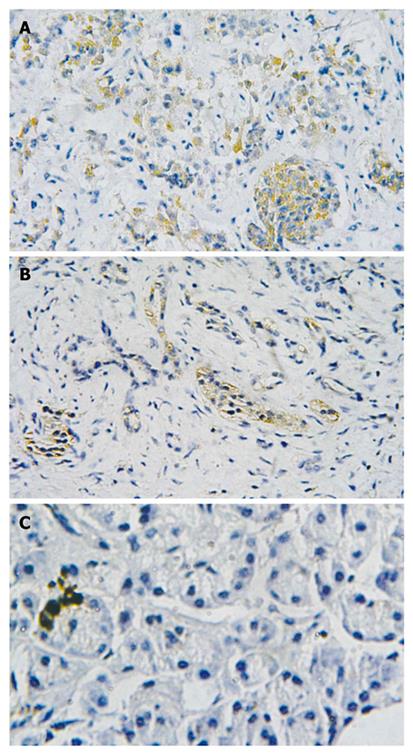
Figure 2 Expression of toll-like receptor 9 protein.
Brown color displays the positive expression. A: Human pancreatic cancer tissue (× 200); B: Peritumoral human pancreatic cancer tissue (× 200); C: Normal pancreas tissue (× 400).
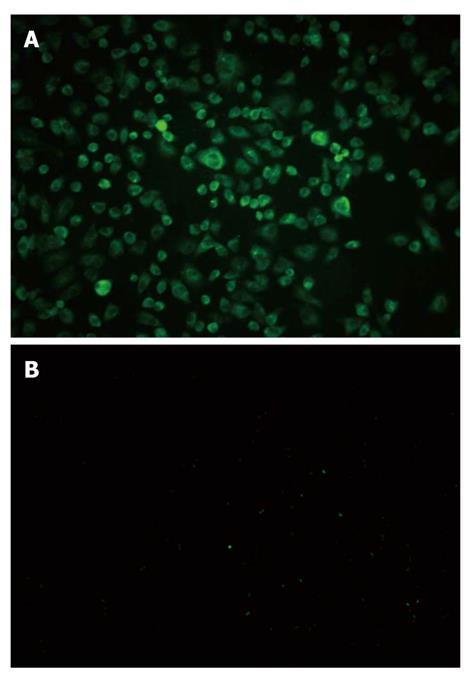
Figure 3 Immunofluorescence staining test.
The expression of toll-like receptor 9 (TLR9) was mainly detected in Panc-1 cell cytoplasm (× 200). A: TLR9 was highly expressed in Panc-1 cells; B: TLR9 was negatively expressed in control group.
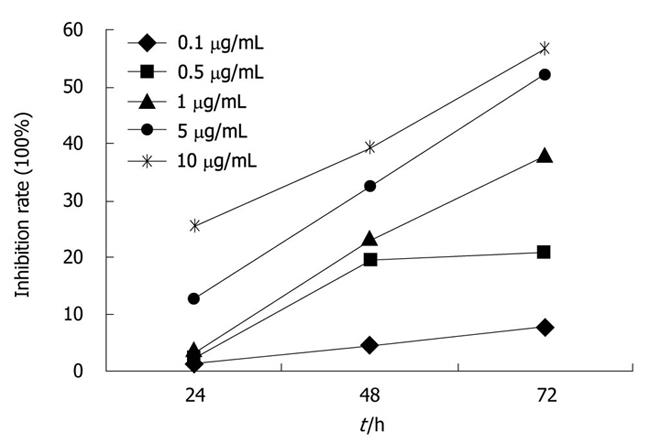
Figure 4 Inhibitory effect of cytosine phosphate-guanosine oligodeoxynucleotides 2216 of different concentrations on Panc-1 cell line with growth inhibition rate increasing remarkablly with concentration and time.
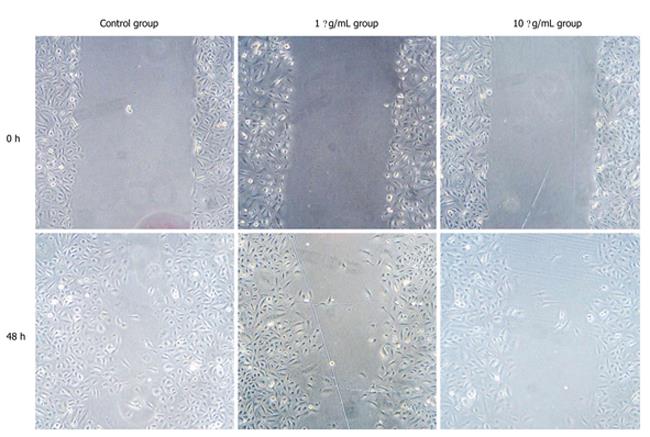
Figure 5 Panc-1 cell scratch test at various time points (× 400).
Compared with control group, a higher cytosine phosphate-guanosine oligodeoxynucleotides 2216 concentration led to significantly lower migration ability (P < 0.01).
Figure 6 Invasion ability of Panc-1 in cabinet (× 200).
A: In control group, there are more Panc-1 cells penetrating through filter membrane; B: The cell number of 1 mg/mL cytosine phosphate-guanosine oligodeoxynucleotides (CPG ODN) treated group penetrating through filter membrane decreased significantly (A vs C, P < 0.01); C: The Panc-1 cell number of 10 mg/L CPG ODN treated group penetrating through filter membrane further decreased (A vs B, P <0.01).
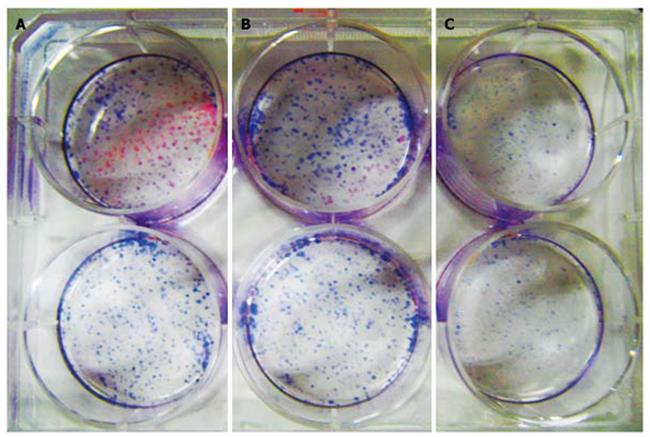
Figure 7 Cell cloning test.
A: More colonies are formed in the control group; B: The colony formed in the 1 mg/L cytosine phosphate-guanosine oligodeoxynucleotides (CPG ODN) treated group is the same as in the control group (P > 0.05); C: There are fewer colonies formed in the 10 mg/L CPG ODN treated group (A vs B, P < 0.01).
- Citation: Wu HQ, Wang B, Zhu SK, Tian Y, Zhang JH, Wu HS. Effects of CPG ODN on biological behavior of PANC-1 and expression of TLR9 in pancreatic cancer. World J Gastroenterol 2011; 17(8): 996-1003
- URL: https://www.wjgnet.com/1007-9327/full/v17/i8/996.htm
- DOI: https://dx.doi.org/10.3748/wjg.v17.i8.996


