Copyright
©2011 Baishideng Publishing Group Co.
World J Gastroenterol. Feb 28, 2011; 17(8): 1045-1050
Published online Feb 28, 2011. doi: 10.3748/wjg.v17.i8.1045
Published online Feb 28, 2011. doi: 10.3748/wjg.v17.i8.1045
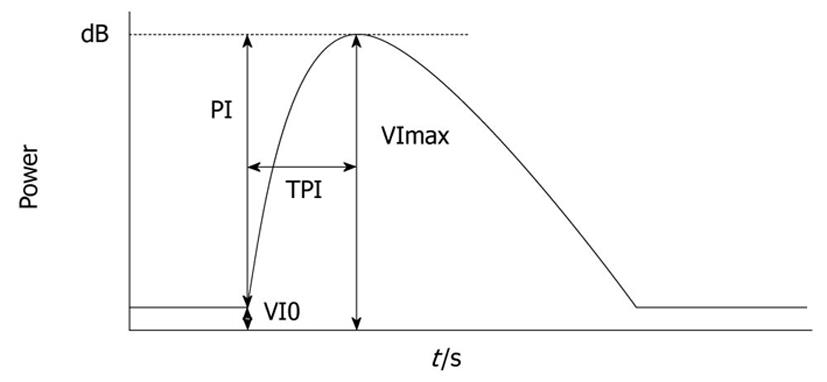
Figure 1 Time intensity curve.
V0 is the baseline intensity of ROI; VImax is the maximal signal of the ROI; PI is the difference between VImax and VI0 (VImax-VI0); time to peak intensity (TPI) is the time required from the onset of tumor contrast enhancement to reach VImax.
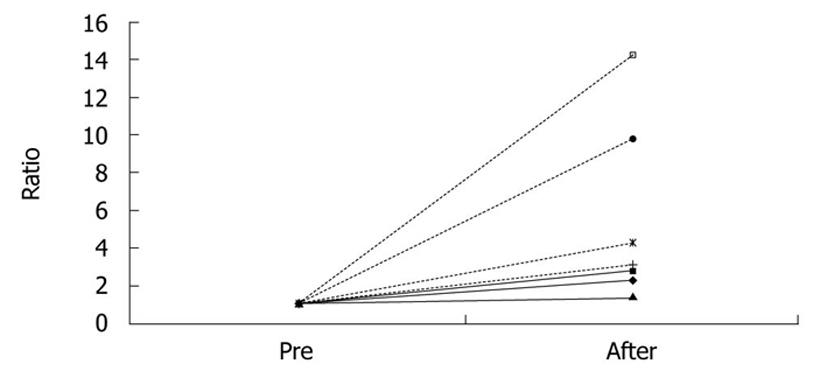
Figure 2 Tumor size variation.
Solid lines show the size variation of the sorafenib-treated group. Interrupted lines show the size variation of the control group. The control group showed greater tumor enlargement than the sorafenib group did.
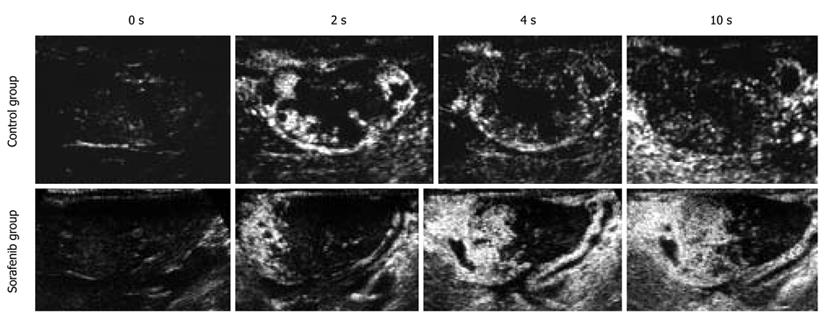
Figure 3 Contrast-enhanced ultrasonography examination showed that time to peak intensity was delayed in the sorafenib-treated group.
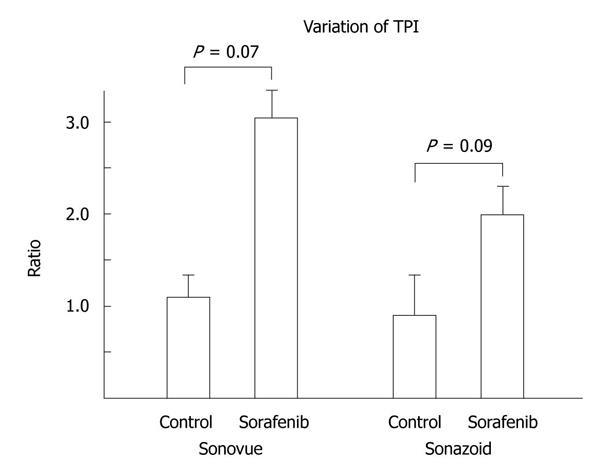
Figure 4 Time to peak intensity in the tumor was significantly prolonged in the sorafenib group with both SonoVue and Sonazoid imaging.
Time to peak intensity (TPI) in the tumor did not change or was shortened in the control group.
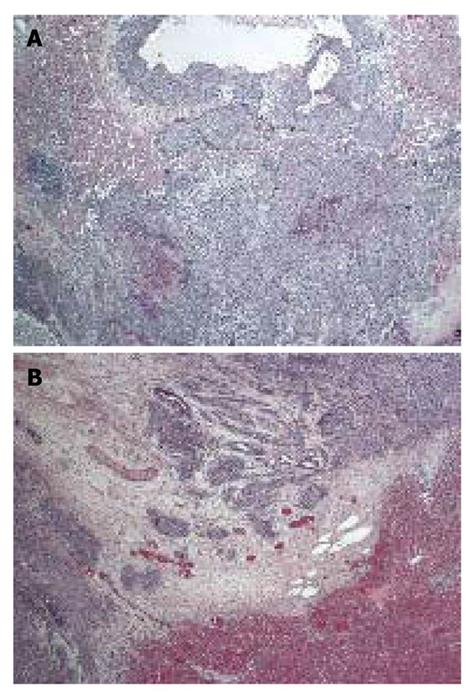
Figure 5 Pathological examination (HE stain, × 40).
A: Sorafenib group: vessels were relatively small and not obvious; B: Control group: dilated vessels were shown in the parenchyma of the tumor.
- Citation: Yoshida K, Hirokawa T, Moriyasu F, Liu L, Liu GJ, Yamada M, Imai Y. Arterial-phase contrast-enhanced ultrasonography for evaluating anti-angiogenesis treatment: A pilot study. World J Gastroenterol 2011; 17(8): 1045-1050
- URL: https://www.wjgnet.com/1007-9327/full/v17/i8/1045.htm
- DOI: https://dx.doi.org/10.3748/wjg.v17.i8.1045


