Copyright
©2011 Baishideng Publishing Group Co.
World J Gastroenterol. Dec 21, 2011; 17(47): 5133-5149
Published online Dec 21, 2011. doi: 10.3748/wjg.v17.i47.5133
Published online Dec 21, 2011. doi: 10.3748/wjg.v17.i47.5133
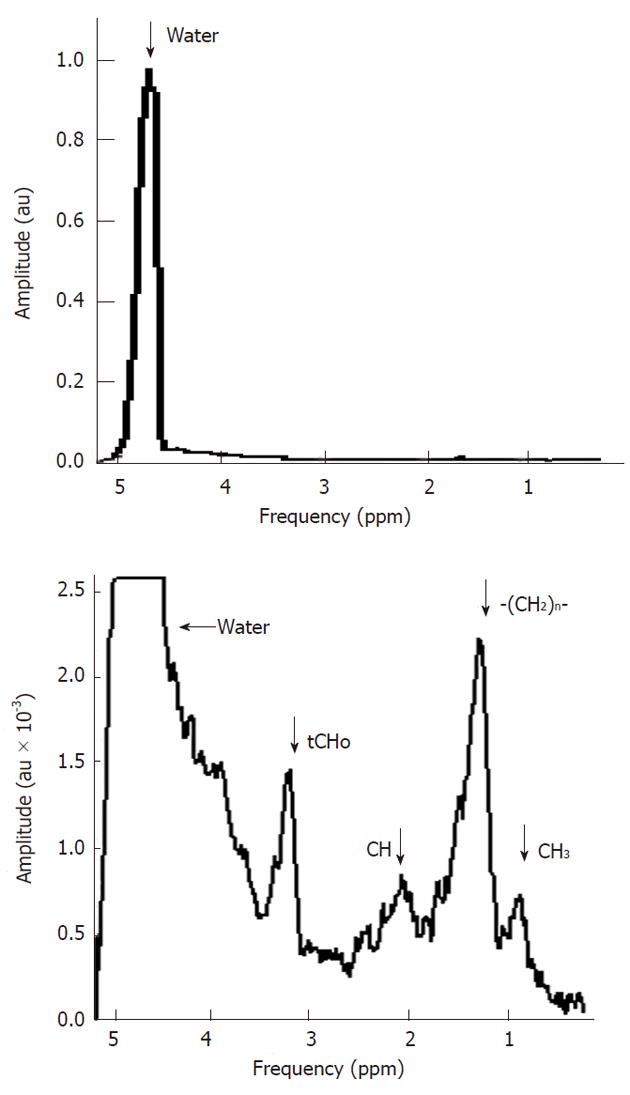
Figure 1 In vivo1H magnetic resonance spectra of human liver tissue obtained from a healthy volunteer on a 3.
0T magnetic resonance system. Above: Spectrum with unsuppressed water signal; Below: Spectrum with partial suppressed water signal, showing the overlapping resonances for N-(CH3)3 protons at about 3.2 ppm occurring in choline compounds (tCho) and resonances for specific protons in lipids.
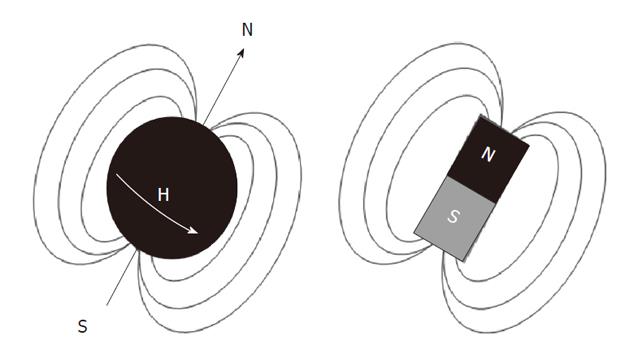
Figure 2 A 1H nucleus spinning around its axes (left) can be regarded as a tiny bar magnet (right).
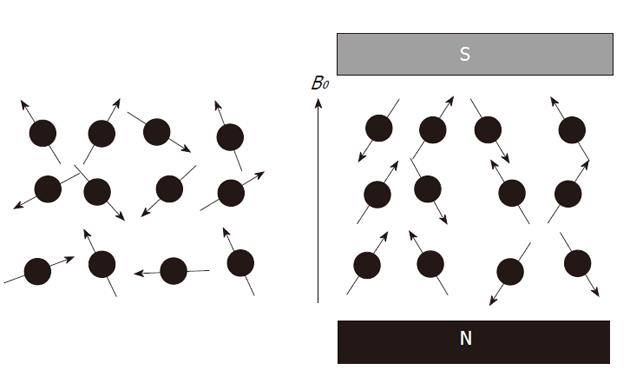
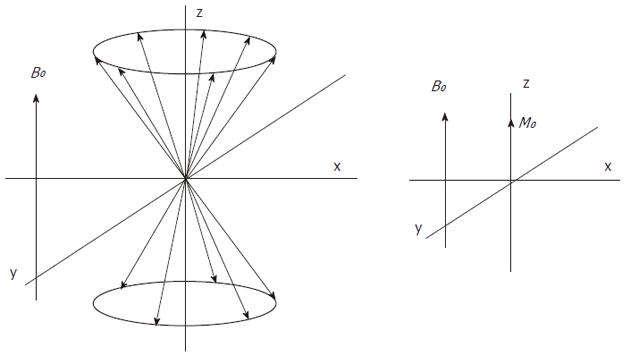
Figure 3 Outside a magnetic field spins have a random orientation (left) but spins inside a strong constant magnetic field B0 will become aligned (right).
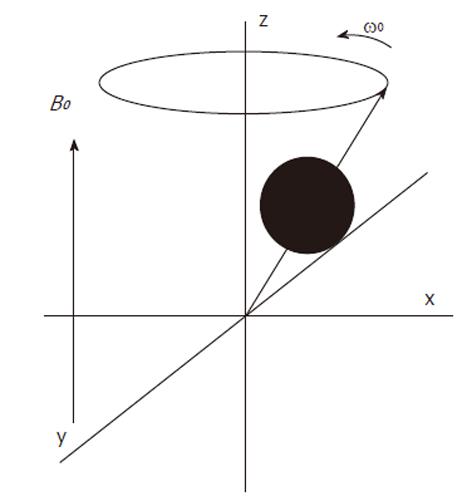
Figure 4 A spin precessing with the Larmor frequency around the axis of B0 at a small angle with respect to this axis.
Figure 5 The direction of the main magnetic field B0, is commonly placed along the z-axis and the magnetization along this axis is Mz, which at equilibrium, equals M0.
Left: Multiple individual spins precessing with the Larmor frequency around the axis of B0. The spin vectors have a random, incoherent phase with respect to each other. Right: Magnetization vector Mz, which at equilibrium, equals M0 (right).
Figure 6 Multiple spins precessing with the Larmor frequency around the direction of B0 (left).
After a 90° radio frequency (RF) pulse, the spin population of the energy levels become equal and the spins precess coherently (middle). The magnetization vector M0, rotates into the transverse (x-y) plane (right).
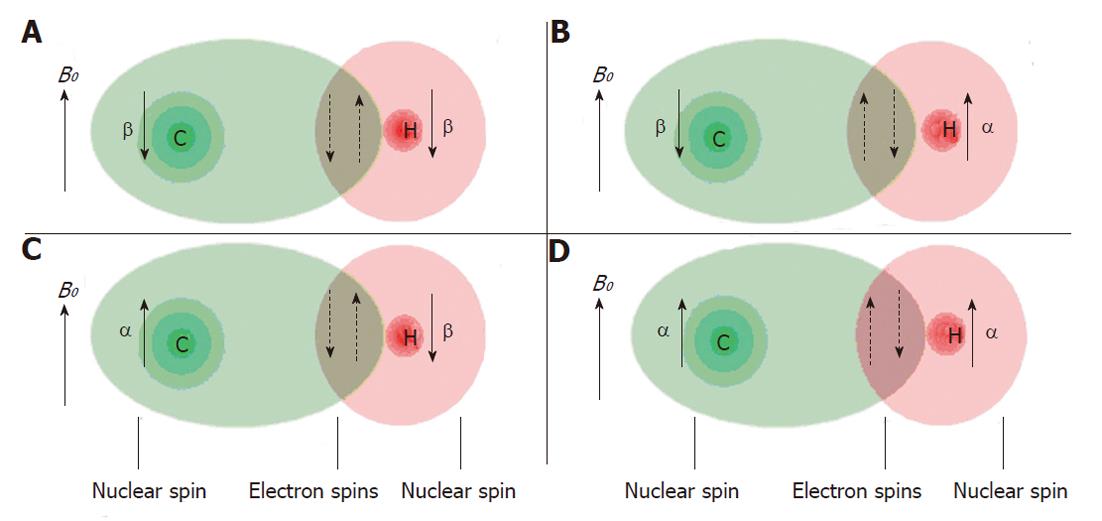
Figure 7 Two bonded nuclei, carbon (C) and hydrogen (H) in decreasing energy levels associated with spin states: ββ (A), βα (B), αβ (C) and αα (D).
The electron clouds around each nucleus are indicated in light green and red. Arrows indicate individual spin states.
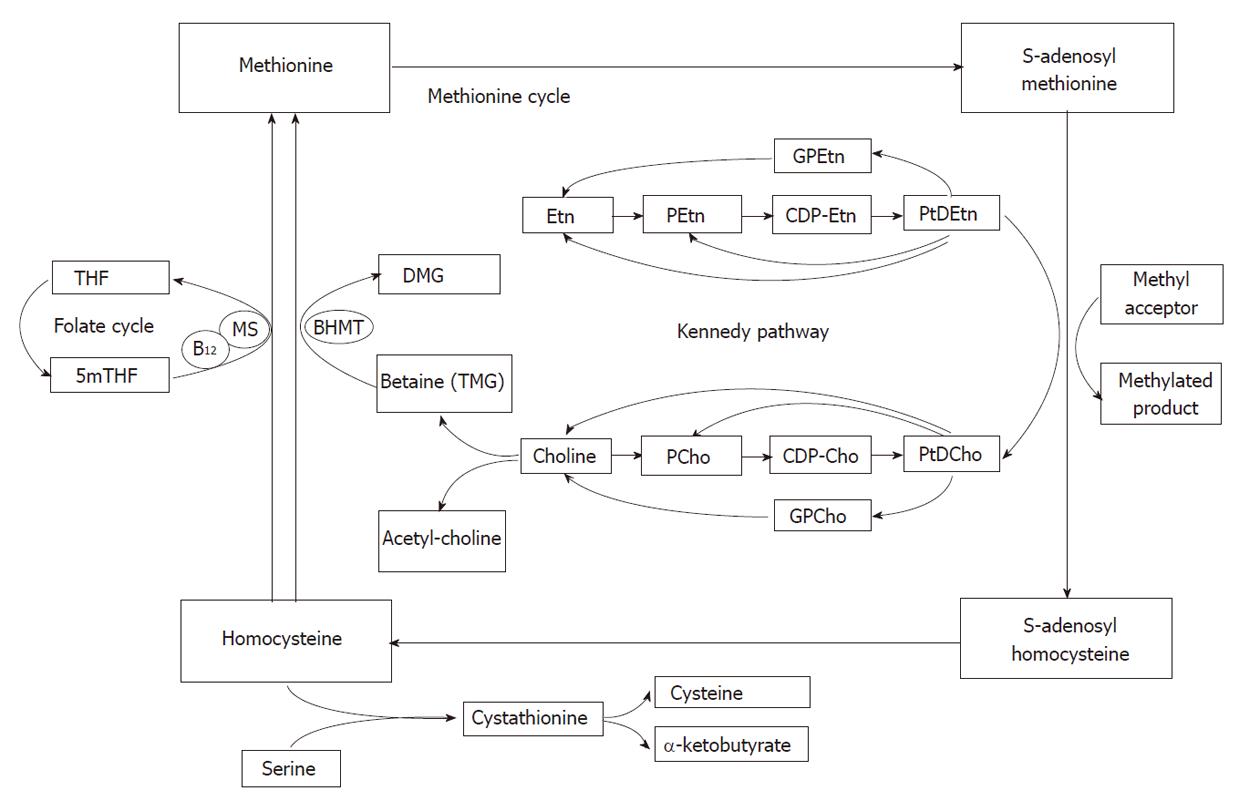
Figure 8 Simplified schematic overview of choline and ethanolamine metabolism including parts of the Kennedy pathway, the methionine and folate cycle.
B12: Vitamin B12; BHMT: Betaine-homocysteine methyltransferase; CDP-Cho: Cytidine diphosphate-choline; CDP-Etn: Cytidine diphosphate-ethanolamine; DMG: Dimethylglycine; Etn: Ethanolamine; GPCho: Glycerol-3-phosphorylcholine; GPEtn: Glycerol-3-phosphorylethanolamine; MS: Methionine synthase; PCho: Phosphorylcholine; PEtn: Phosphorylethanolamine; PtdCho: Phosphatidylcholine; PtdEtn: Phosphatidylethanolamine; THF: Tetrahydrofolate; 5mTHF: 5-methyltetrahydrofolate; TMG: Trimethylglycine (betaine).
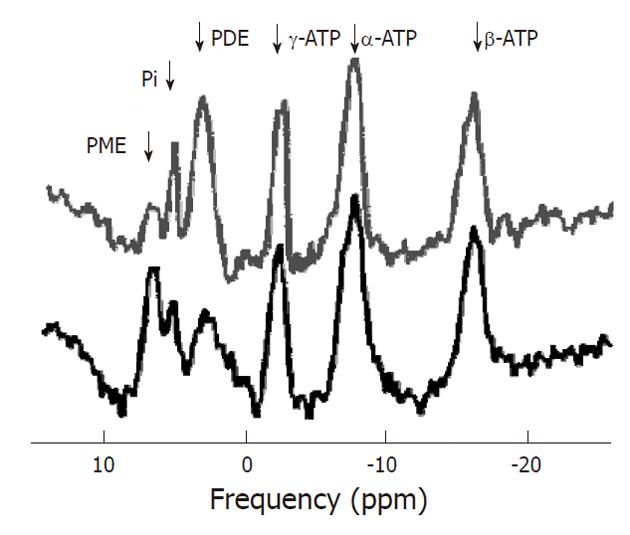
Figure 9 In vivo31P magnetic resonance spectra of human liver tissue obtained from a healthy volunteer (top) and from a patient with hepatocellular carcinoma (bottom).
PME: Phosphomonoesters; PDE: Phosphodiesters; Pi: Inorganic phosphate; ATP: Adenosine triphosphate. (Reproduced with permission of John Wiley and Sons, http://www.interscience.wiley.com, from64.)
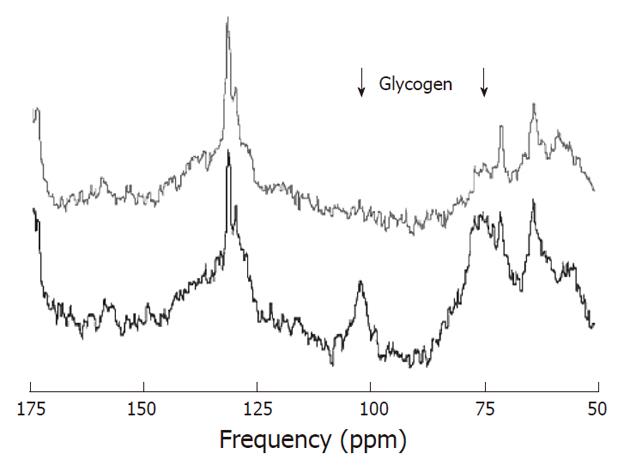
Figure 10 In vivo13C magnetic resonance spectra (1.
5T) of human liver tissue obtained from a healthy volunteer before (bottom) and after exercise (top). Resonances of glycogen (101 ppm and around 75 ppm) are reduced after exercise. Other resonances are mainly lipids.
-
Citation: ter Voert E, Heijmen L, van Laarhoven H, Heerschap A.
In vivo magnetic resonance spectroscopy of liver tumors and metastases. World J Gastroenterol 2011; 17(47): 5133-5149 - URL: https://www.wjgnet.com/1007-9327/full/v17/i47/5133.htm
- DOI: https://dx.doi.org/10.3748/wjg.v17.i47.5133


