Copyright
©2011 Baishideng Publishing Group Co.
World J Gastroenterol. Nov 28, 2011; 17(44): 4875-4882
Published online Nov 28, 2011. doi: 10.3748/wjg.v17.i44.4875
Published online Nov 28, 2011. doi: 10.3748/wjg.v17.i44.4875
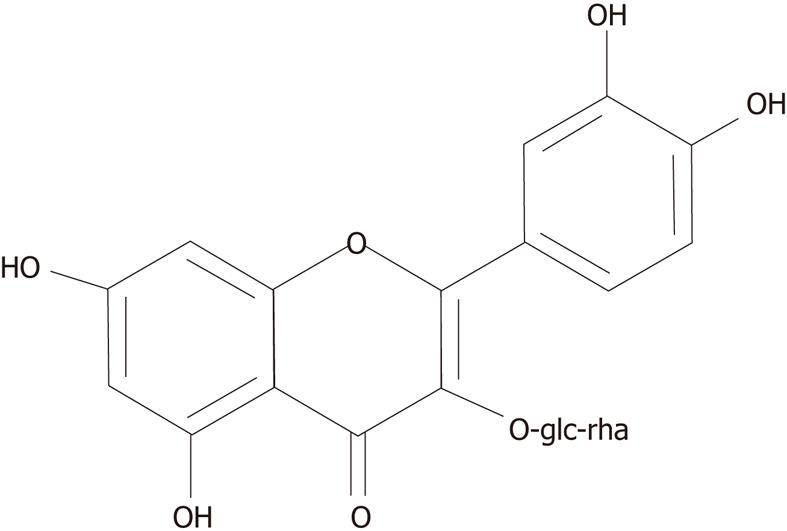
Figure 1 Chemical structure of TTF1.
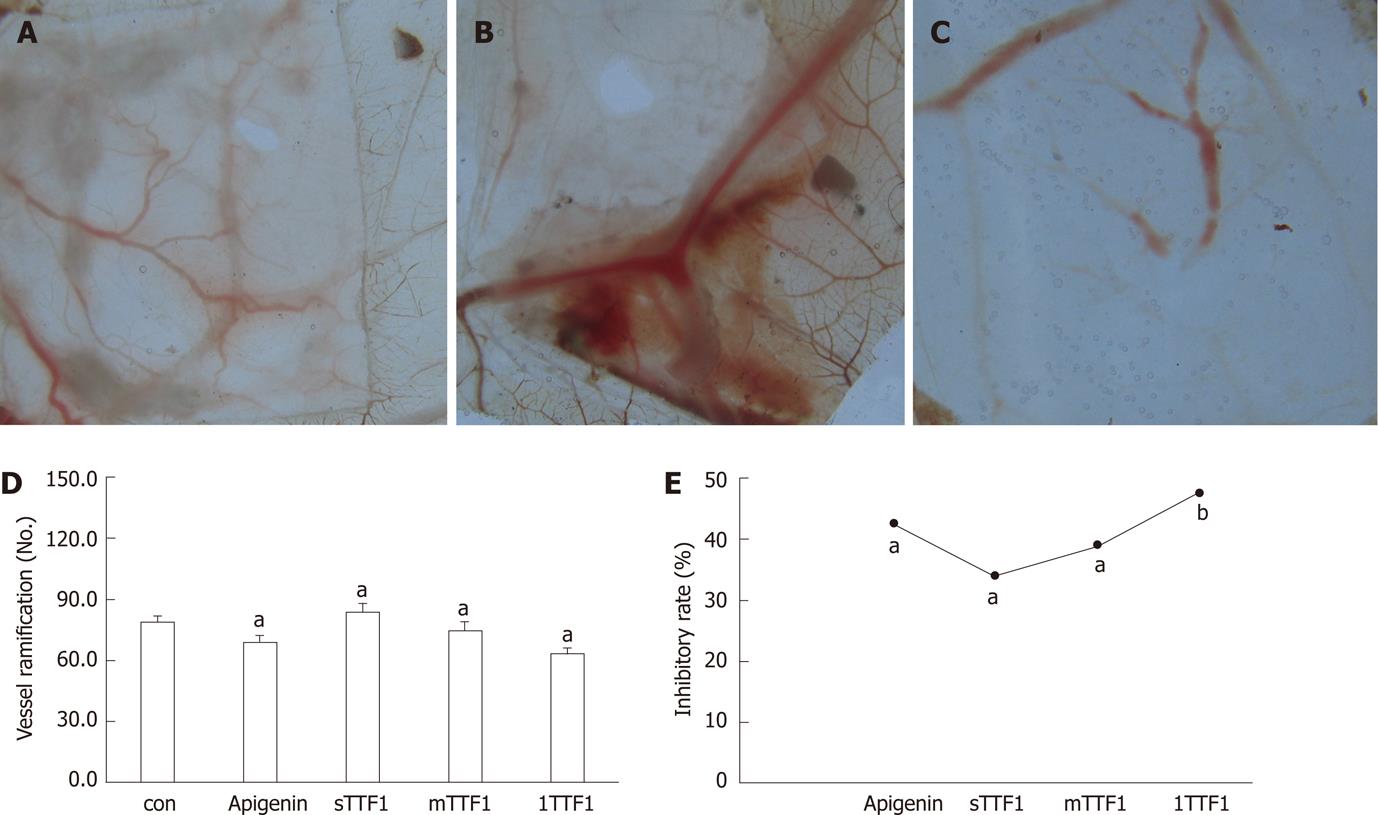
Figure 2 Inhibitory effect of TTF1 on HepG-2 cell-induced angiogenesis in chorioallantoic membrane.
A: Control, inoculated with normal saline; B: Inoculated with HepG-2 cells; C: Inoculated with HepG-2 cells and treated with TTF1; D and E: Different doses of compound were used as treatments in the HepG-2 cell-induced angiogenesis in chorioallantoic membrane (CAM) as follows: sTTF1 (25 μg/embryo × 5 d); mTTF1 (50 μg/embryo × 5 d); lTTF1 (100 μg/embryo × 5 d); apigenin (100 μg/embryo × 5 d); and Con (control group treated with normal saline). aP < 0.05, bP < 0.01 vs control group.
Figure 3 Effect of TTF1 on tumor weight in HepG-2-transplanted nude mice.
Different doses of compound were used as treatments in the HepG-2-transplanted nude mice as follows: sTTF1 (5 μmol/kg); mTTF1 (10 μmol/kg); lTTF1 (20 μmol/kg); apigenin (40 μmol/kg); and Con (control group treated with normal saline). Compared to the control group. aP < 0.05 vs control group
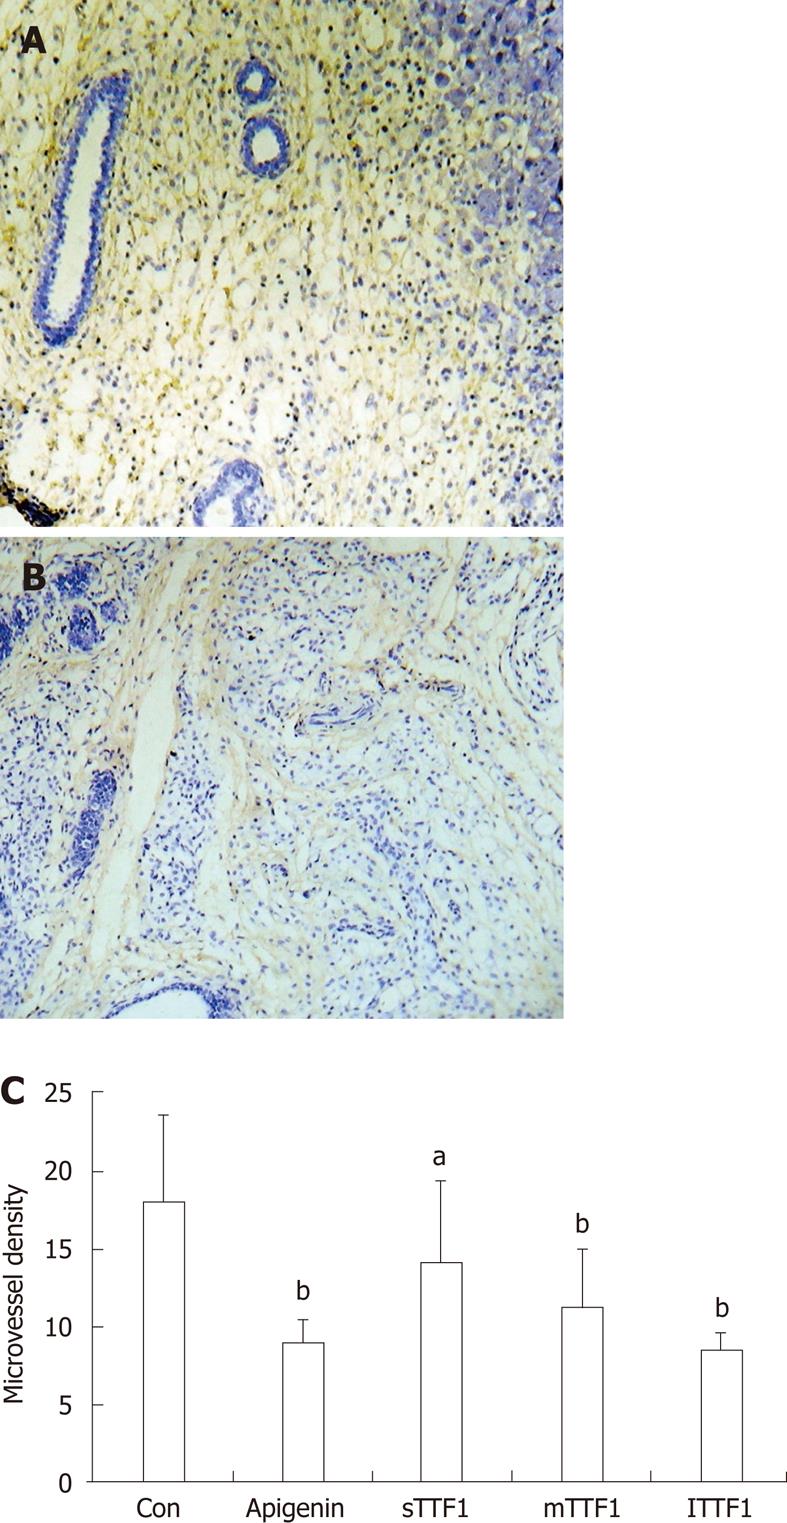
Figure 4 Microvessels in tumor tissue angiogenesis in HepG-2-transplanted nude mice.
Brown staining indicates CD34 positive cells. A: Control, HepG-2-transplanted nude mouse treated with normal saline; B: TTF1, HepG-2-transplanted nude mouse treated with TTF1; C: Different doses of compound were used as treatments in the HepG-2-transplanted nude mice as follows: sTTF1 (5 μmol/kg); mTTF1 (10 μmol/kg); lTTF1 (20 μmol/kg); apigenin (40 μmol/kg); and Con (control group treated with normal saline). aP < 0.05, bP < 0.01 vs control group.
Figure 5 Down-regulation of expression of vascular endothelial growth factor by TTF1 (× 200).
Brown staining indicates vascular endothelial growth factor positive. Different doses of compound were used as treatments in the HepG-2-transplanted nude mice as follows: A: sTTF1 (5 μmol/kg); B: TTF1 (10 μmol/kg); C: lTTF1 (20 μmol/kg); D: Apigenin (40 μmol/kg); E: Con (control group treated with normal saline).
Figure 6 Down-regulation of expression of bFGF by TTF1 (× 200).
Brown staining indicates bFGF-positive cells. Different doses of compound were used as treatments in the HepG-2-transplanted nude mice as follows: A: sTTF1 (5 μmol/kg); B: TTF1 (10 μmol/kg); C: lTTF1 (20 μmol/kg); D: Apigenin (40 μmol/kg); E: Con (control group treated with normal saline).
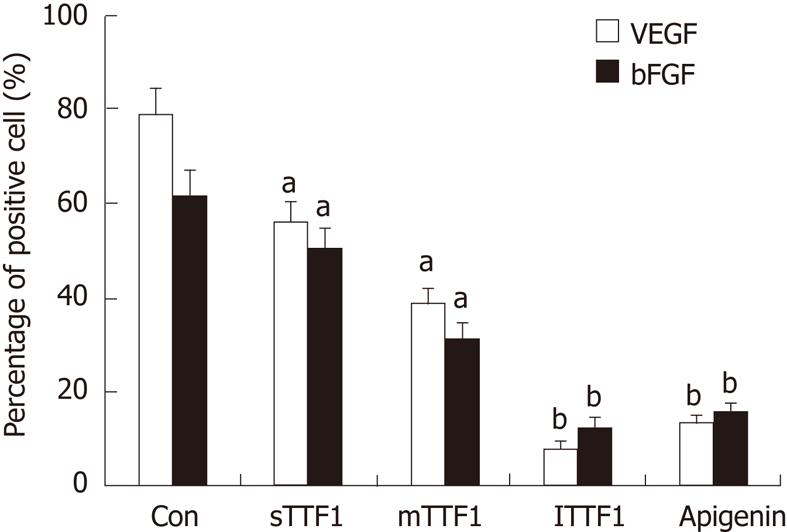
Figure 7 Quantify the effects of TTF1 on the expressions of vascular endothelial growth factor and basic fibroblast growth factor.
Different doses of compound were used as treatments in the HepG-2-transplanted nude mice as follows: sTTF1 (5 μmol/kg), TTF1 (10 μmol/kg), lTTF1 (20 μmol/kg), apigenin (40 μmol/kg), and Con (control group treated with normal saline). aP < 0.05, bP < 0.01 vs control group. VEGF: Vascular endothelial growth factor; bFGF: Basic fibroblast growth factor.
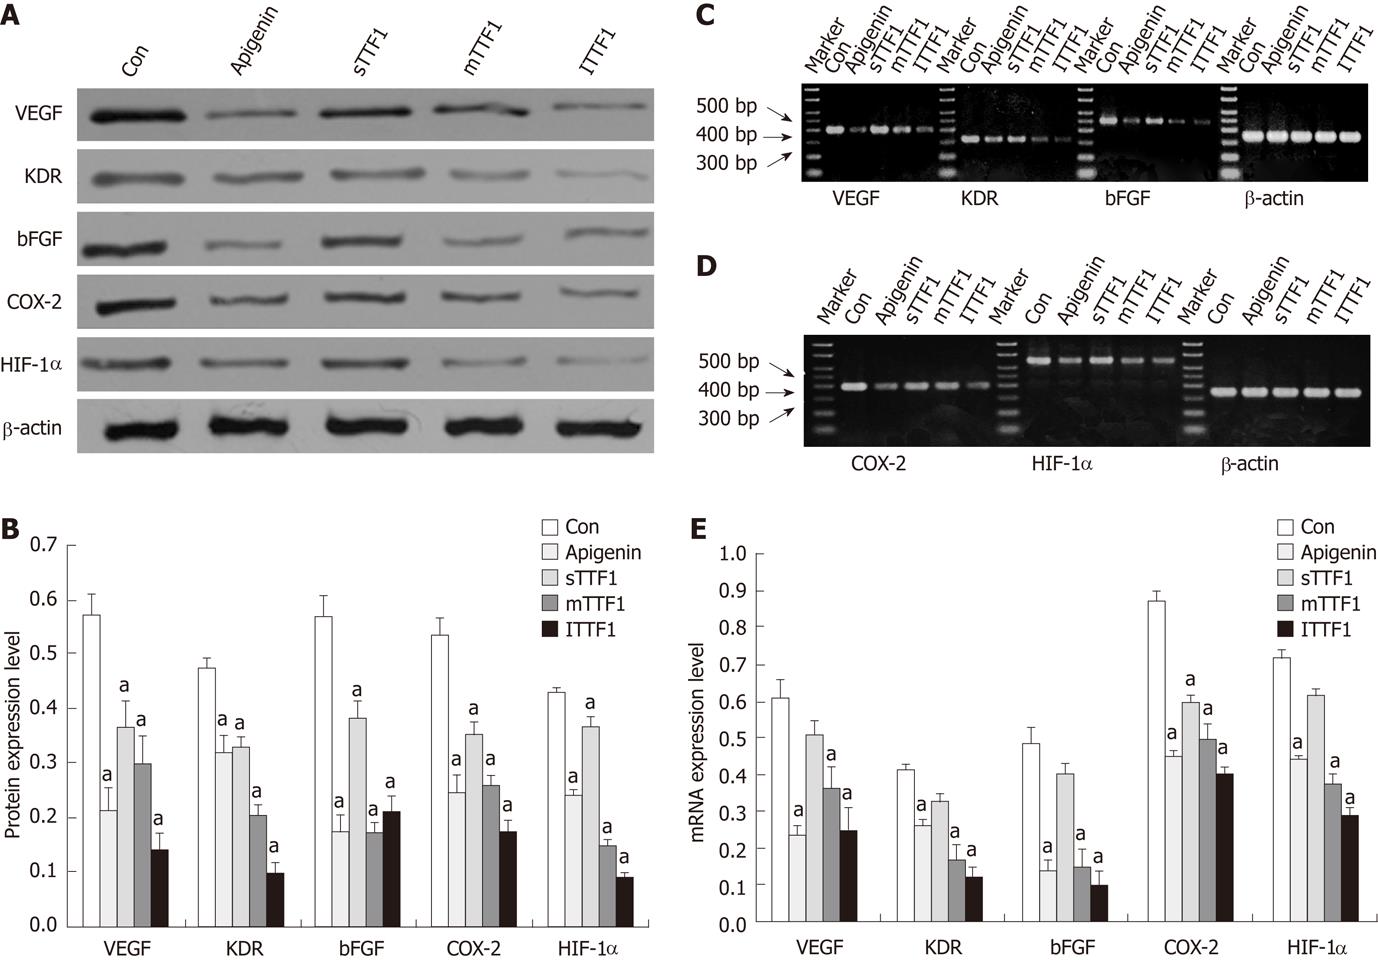
Figure 8 TTF1 decreases the gene and protein level of angiogenesis regulation factors.
Western blotting analysis was used to determine the protein levels of VEGF, KDR, bFGF, COX-2 and HIF-1α. A: Tumor tissues were centrifuged at 12 000 g for 15 min and the supernatant (70 μg/lane) was subjected to sodium dodecyl sulfate polyacrylamide gel electrophoresis. Western blotting analysis was performed to detect the protein levels of VEGF, KDR, bFGF, COX-2 and HIF-1α. Different compounds and dosages were used as treatments in the HepG-2-transplanted nude mice as follows: sTTF1 (5 μmol/kg); mTTF1 (10 μmol/kg); lTTF1 (20 μmol/kg); apigenin (40 μmol/kg); and Con (control group treated with normal saline); B: The intensity of the VEGF, KDR, bFGF, COX-2 and HIF-1α protein bands were determined and normalized with β-actin’s intensity by using the ultraviolet crosslinkers imager and plotted (aP < 0.05 vs control group); C-E: Quantitative real-time PCR was performed to determine the mRNA expression levels of VEGF, KDR, bFGF, COX-2 and HIF-1α (aP < 0.05 vs control group).
- Citation: Liu C, Li XW, Cui LM, Li LC, Chen LY, Zhang XW. Inhibition of tumor angiogenesis by TTF1 from extract of herbal medicine. World J Gastroenterol 2011; 17(44): 4875-4882
- URL: https://www.wjgnet.com/1007-9327/full/v17/i44/4875.htm
- DOI: https://dx.doi.org/10.3748/wjg.v17.i44.4875


