Copyright
©2011 Baishideng Publishing Group Co.
World J Gastroenterol. Nov 14, 2011; 17(42): 4675-4681
Published online Nov 14, 2011. doi: 10.3748/wjg.v17.i42.4675
Published online Nov 14, 2011. doi: 10.3748/wjg.v17.i42.4675
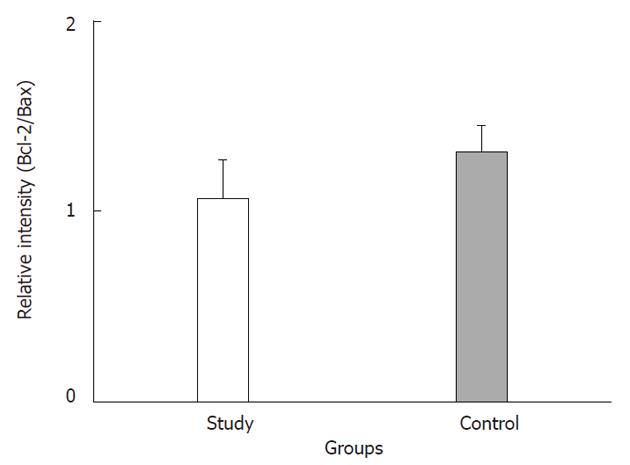
Figure 1 Relative intensity (ratio) of protein abundance of Bcl-2 to Bax in the study and control groups.
Study: HCC post-TAE; Control: HCC. HCC: Hepatocellular carcinoma; TAE: Transarterial embolization.
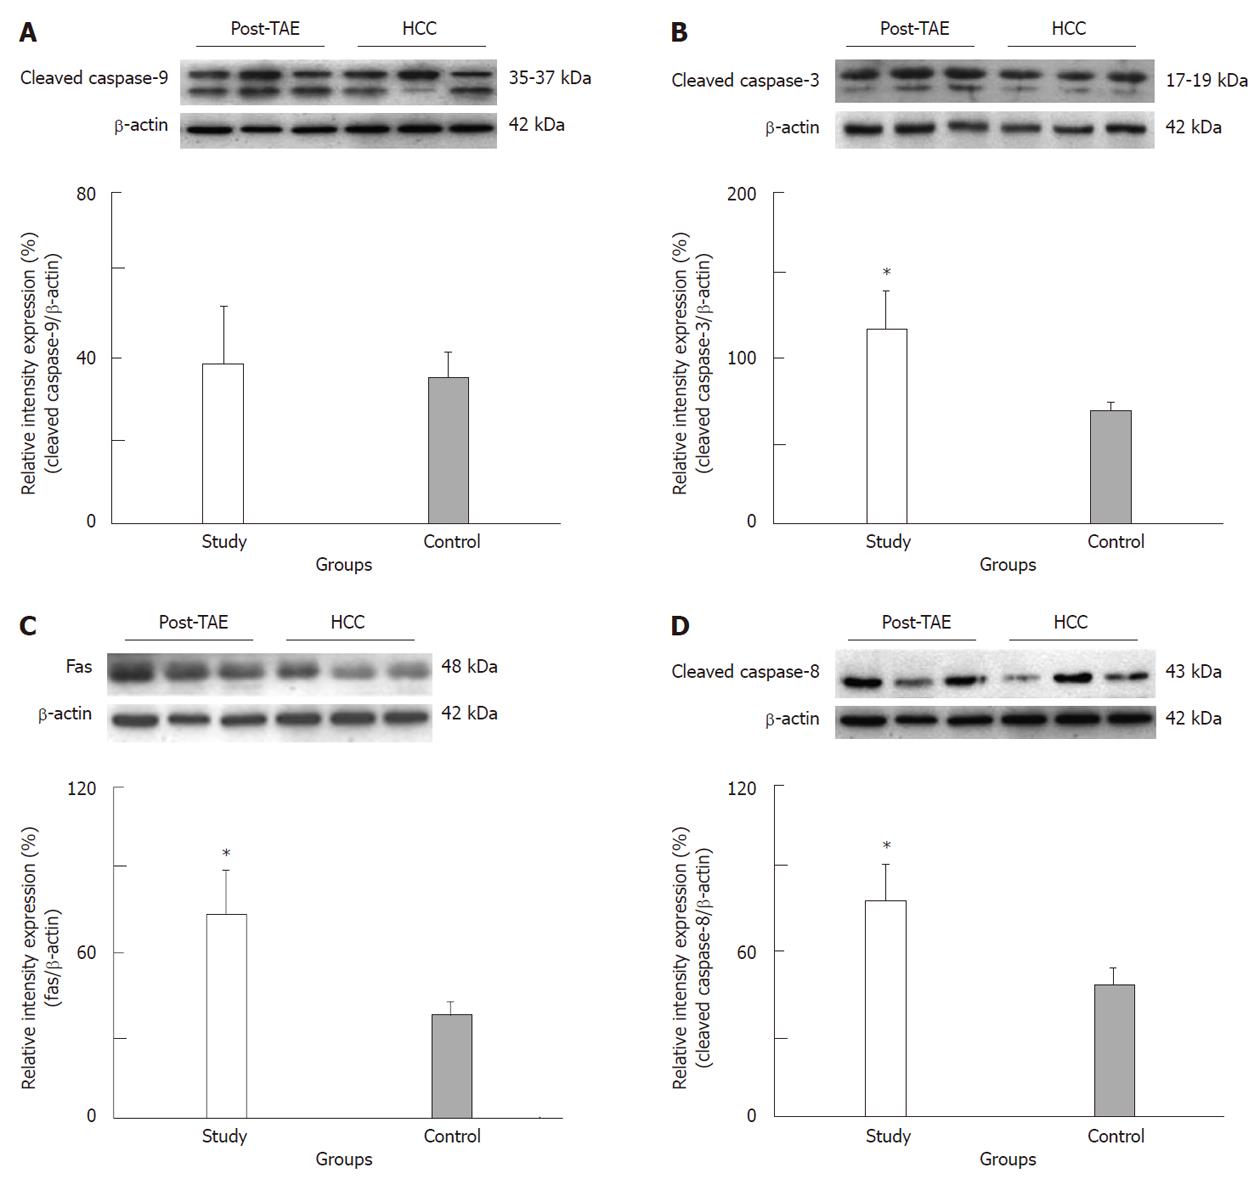
Figure 2 Representative immunoblot and relative intensities of cleaved caspase-9 (A), cleaved caspase-3 (B), Fas (C) and cleaved caspase-8 (D) proteins in the study and control groups.
β-actin was used as a loading control. The asterisk indicates a significant difference between the study (HCC post-TAE) and control (HCC) groups. HCC: Hepatocellular carcinoma; TAE: Transarterial embolization.
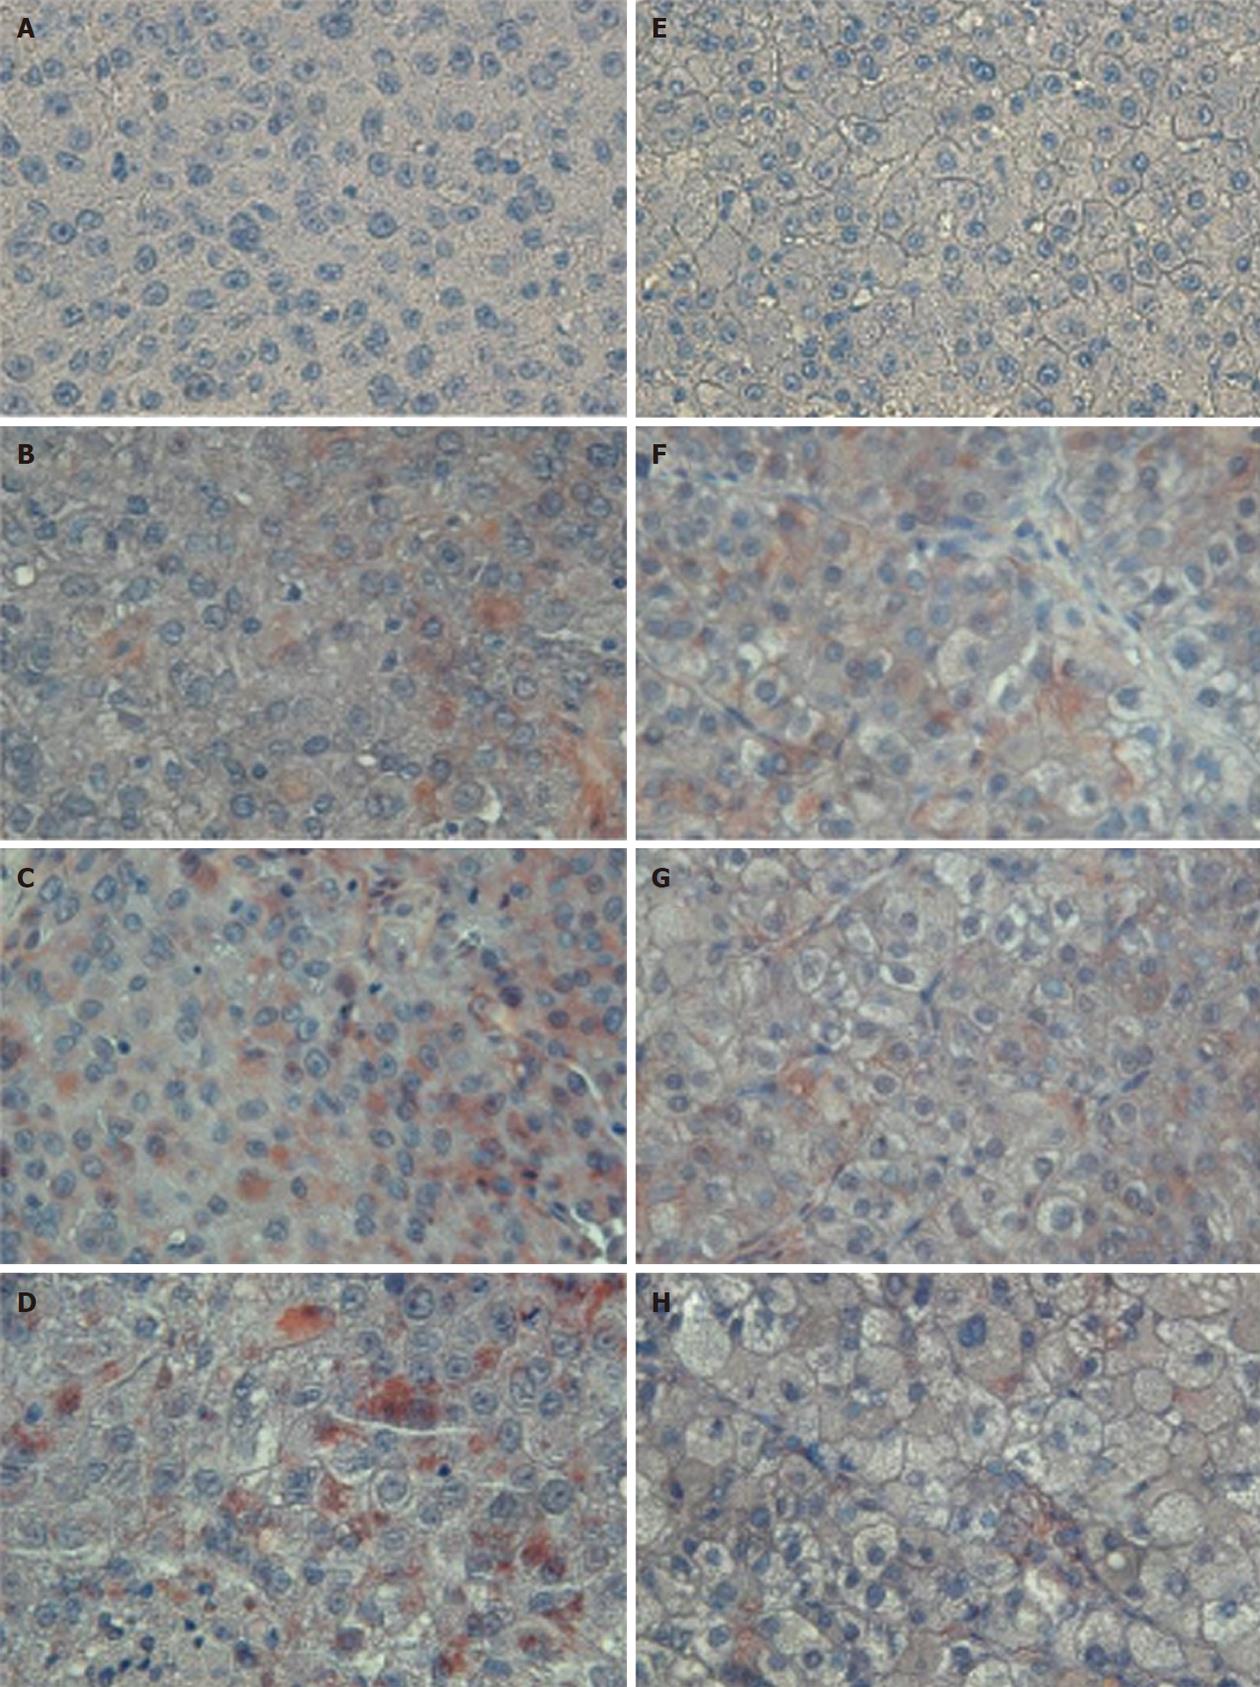
Figure 3 Representative sections of patients from the study (A-D) and control (E-H) groups after hematoxylin staining (negative control, A and E), caspase-9 immunostaining (B and F), caspase-8 immunostaining (C and G) or cleaved caspase-3 immunostaining (D and H).
Study: HCC post-TAE; Control: HCC. Higher immunoreactivity of caspase-8 and cleaved caspase-3 stain was observed in the study group than in the control group. Magnification, 400 ×. HCC: Hepatocellular carcinoma; TAE: Transarterial embolization.
- Citation: Wang SH, Chen LM, Yang WK, Lee JD. Increased extrinsic apoptotic pathway activity in patients with hepatocellular carcinoma following transarterial embolization. World J Gastroenterol 2011; 17(42): 4675-4681
- URL: https://www.wjgnet.com/1007-9327/full/v17/i42/4675.htm
- DOI: https://dx.doi.org/10.3748/wjg.v17.i42.4675


