Copyright
©2011 Baishideng Publishing Group Co.
World J Gastroenterol. Jan 28, 2011; 17(4): 478-487
Published online Jan 28, 2011. doi: 10.3748/wjg.v17.i4.478
Published online Jan 28, 2011. doi: 10.3748/wjg.v17.i4.478
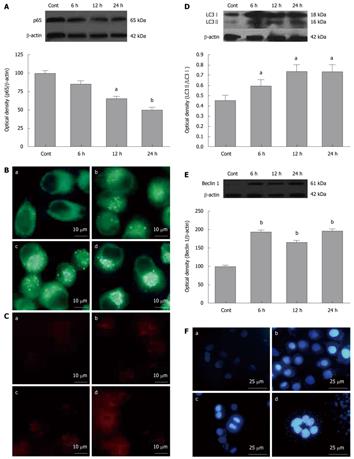
Figure 1 Blocking nuclear factor-κB nuclear translocation activates autophagy and induces cell apoptosis.
A: Western blotting analysis of the nuclear p65 in the control and SN50-treated SGC7901 cells. Western blotting analysis was used to detect the nuclear protein levels of p65 after SN50 treatment for 6-24 h. SGC7901 cells were treated with SN50 (18 μmol/L) at various time points and were harvested for nuclear p65 protein levels. It indicates that SN50 may down-regulate the expression of nuclear p65. Values were given as mean ± SE. Statistical comparisons were carried out with Dennett’s test. aP < 0.05 and bP < 0.01 vs control (n = 3); B: Autophagy was activated after SN50 treatment. SGC7901 cells were incubated with SN50 (18 μmol/L) and stained with MDC (100 μmol/L). Fluorescence particles indicate L-AVs. (a) control, (b) 6 h, (c) 12 h, (d) 24 h after SN50 treatment (× 1000) (n = 3); C: MAP1 LC3 expression and location in SGC7901 cells after treatment with SN50. Cells were treated with SN50 (18 μmol/L) for 6 h (b), 12 h (c) and 24 h (d), and observed under immunofluorence microscope. (a) Control (× 1000) (n = 3). SN50 increased the punctuate distribution of LC3 from 6 to 24 h; D: Western blotting analysis of the LC3 in the control and SN50-treated SGC7901 cells. Western blotting analysis was used to detect the protein levels of LC3 after SN50 treatment for 6-24 h. SGC7901 cells were treated with SN50 (18 μmol/L) and were harvested for total proteins. It indicates that SN50 may up-regulate the expression of LC3I and LC3II. SN50 increased the ratio of LC3II/LC3I. Values were given as mean ± SE. Statistical comparisons were carried out with Dennett’s test. aP < 0.05 vs control (n = 3); E: Western blotting analysis of the Beclin 1 in the control and SN50-treated SGC7901 cells. Western blotting analysis was used to detect the protein levels of Beclin 1 after SN50 treatment for 6-24 h. SGC7901 cells were treated with SN50 (18 μmol/L) and were harvested for total proteins. It indicates that SN50 may up-regulate the expression of Beclin 1. Values were given as mean ± SD. Statistical comparisons were carried out with Dennett’s test. bP < 0.01 vs control (n = 3); F: Hoechst 33258 staining showed apoptosis was induced after SN50 (18 μmol/L) treatment. SGC7901 cells were incubated with SN50 (18 μmol/L) and stained with Hoechst 33258 (10 mmol/L). Fluorescence particles showed apoptosis. (A) control, (B) 6 h, (C) 12 h, (D) 24 h after SN50 treatment (× 400) (n = 3).
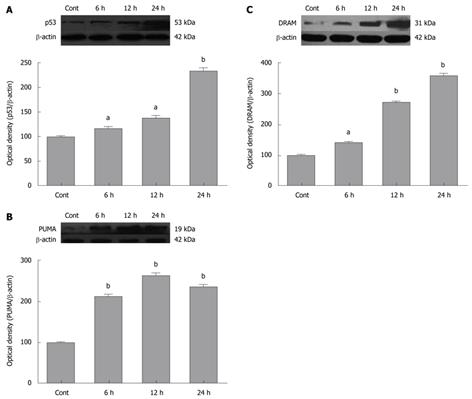
Figure 2 Blocking nuclear factor-κB nuclear translocation induces p53 and its target proteins.
A: Western blotting analysis of p53 of the control and SN50-treated SGC7901 cells. Western blotting analysis was used to detect the protein levels of p53 after SN50 treatment for 6-24 h. SGC7901 cells were treated with SN50 (18 μmol/L) and were harvested for total proteins. It indicates that SN50 may up-regulate the expression of p53. Values were given as mean ± SD. Statistical comparisons were carried out with Dennett’s test. aP < 0.05 and bP < 0.01 vs control (n = 3); B: Western blotting analysis of P53 upregulated modulator of apoptosis (PUMA) of the control and SN50-treated SGC7901 cells. Western blotting analysis was used to detect the protein levels of PUMA after SN50 treatment for 6-24 h. SGC7901 cells were treated with SN50 (18 μmol/L) and were harvested for total proteins. It indicates that SN50 may up-regulate the expression of PUMA. Values were given as mean ± SD. Statistical comparisons were carried out with Dennett’s test. bP < 0.01 vs control (n = 3); C: Western blotting analysis of damage-regulated autophagy modulator (DRAM) of the control and SN50-treated SGC7901 cells. Western blotting analysis was used to detect the protein levels of DRAM after SN50 treatment for 6-24 h. SGC7901 cells were treated with SN50 (18 μmol/L) and were harvested for total proteins. It indicates that SN50 may up-regulate the expression of DRAM. Values were given as mean ± SD. Statistical comparisons were carried out with Dennett’s test. aP < 0.05 and bP < 0.01 vs control (n = 3).
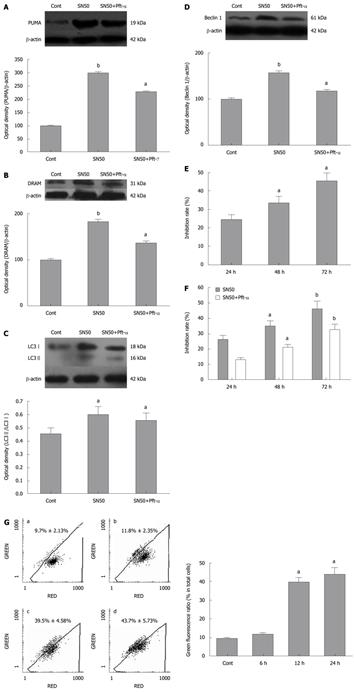
Figure 3 P53 inhibitor blocks SN50-induced autophagy activation and cell apoptosis.
A: Effects of p53 inhibitor Pifithrin (Pft)-α on SN50-induced P53 upregulated modulator of apoptosis (PUMA) expression of SGC7901 cells. SGC7901 cells were pretreated with Pft-α (30 μmol/L) 6 h before SN50 (18 μmol/L). Protein expression was evaluated by Western blotting at 24 h. Results were presented as mean ± SD of three independent experiments. aP < 0.05 and bP < 0.01 vs control group; B: Effects of p53 inhibitor Pft-α on SN50-induced damage-regulated autophagy modulator (DRAM) expression of SGC7901 cells. SGC7901 cells were pretreated with Pft-α (30 μmol/L) 6 h before SN50 (18 μmol/L). Protein expression was evaluated by Western blotting at 24 h. Results were presented as mean ± SD of three independent experiments. aP < 0.05 and bP < 0.01 vs control group; C: Effects of p53 inhibitor Pft-α on SN50-induced LC3 expression of SGC7901 cells. SGC7901 cells were pretreated with Pft-α (30 μmol/L) 6 h before SN50 (18 μmol/L). Protein expression was evaluated by Western blotting at 24 h. Results were presented as mean ± SD of three independent experiments. aP < 0.05 vs control group; D: Effects of p53 inhibitor Pft-α on SN50-induced Beclin 1 expression of SGC7901 cells. SGC7901 cells were pretreated with Pft-α (30 μmol/L) 6 h before SN50 (18 μmol/L). Protein expression was evaluated by Western blotting at 24 h. Results were presented as mean ± SD of three independent experiments. aP < 0.05 and bP < 0.01 vs control; E: Reduced viability of SGC7901 cells after SN50 treatment. SGC7901 cells (7 × 10⁴ cells/mL) were cultured with 18 μmol/L of SN50 and cell viability was analyzed by MTT assay. MTT assays revealed that the inhibition rate reached 25.31% ± 4.13%, 34.19% ± 2.06%, 44.79% ± 1.65% after treatment of SN50 (18 μmol/L) 24,48 and 72 h. Values were given as mean ± SD of three independent experiments. aP < 0.05 and vs control; F: P53 inhibitor may attenuate the inhibitory effects of SN50-induced death of SGC7901 cells. SGC7901 cells were pretreated with Pft-α (30 μmol/L) 6 h before SN50 treatment (18 μmol/L). Cell viability was evaluated by MTT assay at 24, 48 and 72 h. Results were presented as mean ± SD of three independent experiments. aP < 0.05 vs control, bP < 0.01 compared with SN50 alone treated group; G: Flow cytometric analysis of mitochondria membrane potential in the control and SN50-treated SGC7901 cells. Cells were treated with SN50 (18 μmol/L) for 6, 12 and 24 h and were stained with JC-1 (5 μmol/L) for 30 min. Values were given as mean ± SD. Statistical analysis was carried out with ANOVA followed by Dunnett’s t test. aP < 0.05 vs control.
- Citation: Zhu BS, Xing CG, Lin F, Fan XQ, Zhao K, Qin ZH. Blocking NF-κB nuclear translocation leads to p53-related autophagy activation and cell apoptosis. World J Gastroenterol 2011; 17(4): 478-487
- URL: https://www.wjgnet.com/1007-9327/full/v17/i4/478.htm
- DOI: https://dx.doi.org/10.3748/wjg.v17.i4.478


