Copyright
©2011 Baishideng Publishing Group Co.
World J Gastroenterol. Jan 28, 2011; 17(4): 470-477
Published online Jan 28, 2011. doi: 10.3748/wjg.v17.i4.470
Published online Jan 28, 2011. doi: 10.3748/wjg.v17.i4.470
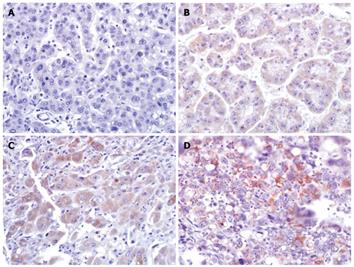
Figure 1 Expression pattern of E2F5 in primary hepatocellular carcinoma by tissue microarray based immunohistochemistry.
Cytoplasmic staining was considered E2F5 expression positive. E2F5 expression was absent in all normal liver tissues tested. A: No E2F5 expression; B-D: Grade 1 to 3 E2F5 expression, respectively (× 400).
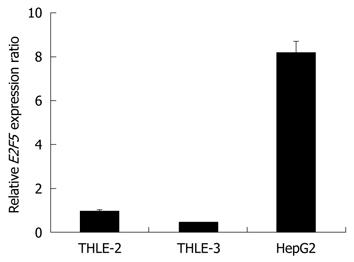
Figure 2 E2F5 RNA expressions of HepG2 and normal liver cell lines (THLE-2 and -3).
E2F5 gene specific reverse transcriptase polymerase chain reaction was performed for HepG2, THLE-2 and THLE-3 as described in methods. In HepG2 cell line, E2F5 RNA expression was up-regulated more than 8 fold compared with that of the normal liver cells.
Figure 3 Small interfering RNA-mediated silencing of E2F5 gene expression in HepG2 cells.
A: After siE2F5 transfection into the HepG2 cells, E2F5 expression was measured by real time quantitative reverse transcriptase polymerase chain reaction. Human GAPDH gene was used as an internal control. The X axis represents samples and the Y axis relative E2F5 expression ratios (siE2F5 or siNEG/control); B: E2F5 expression in Western blotting analysis was measured by densitometry. Alpha-tubulin was used as an internal control. E2F5 specific signal intensities of siE2F5-treated cells are profoundly repressed compared with siNEG-treated cells. Control: HepG2 cells without transfection; siNEG: Negative oligonucleotide (siNEG) transfected HepG2.
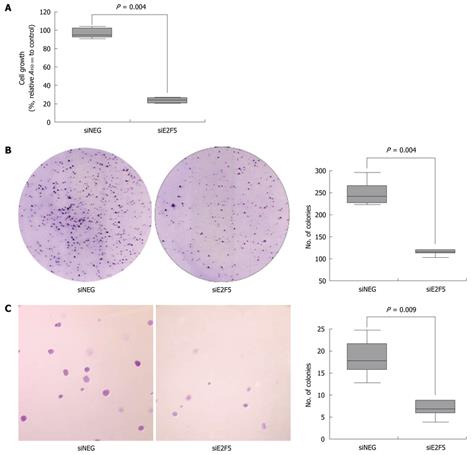
Figure 4 Effects of E2F5 knockdown on HepG2 cell growth.
Proliferation assay (A), colony formation assay (B), and soft agar assay (C) consistently demonstrated the inhibition of HepG2 cell growth by E2F5-specific small interfering RNA transfection (× 40).
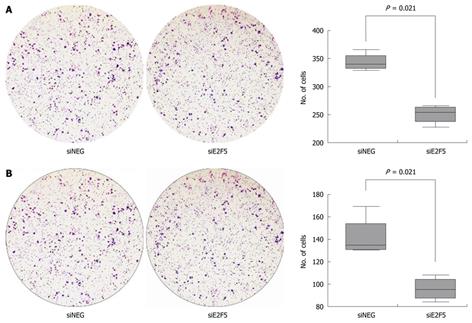
Figure 5 Effects of E2F5 knockdown on migration and invasion of HepG2 cells.
A: The number of migrating colonies in siE2F5 treated cells was significantly lower than that in siNEG transfected cells on Matrigel uncoated transwell membrane (P = 0.021); B: The number of invading colonies in siE2F5 treated cells was significantly lower than that in siNEG transfected cells into Matrigel coated transwell membrane (P = 0.021).
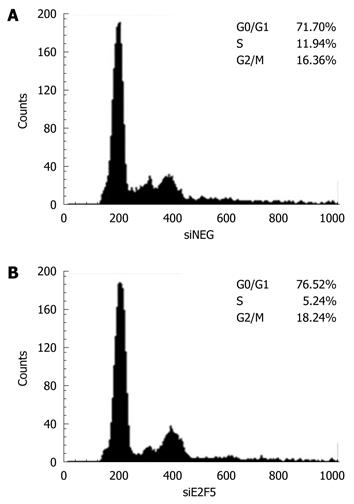
Figure 6 Effect of siE2F5 treatment on HepG2 cell cycle progression.
After siE2F5 transfection into the HepG2 cells, cell cycle profile was examined by flow cytometry analysis. DNA histogram shows the accumulation of G0/G1-phase cells in siE2F5 transfected HepG2 cells compared with the siNEG transfected cells.
- Citation: Jiang Y, Yim SH, Xu HD, Jung SH, Yang SY, Hu HJ, Jung CK, Chung YJ. A potential oncogenic role of the commonly observed E2F5 overexpression in hepatocellular carcinoma. World J Gastroenterol 2011; 17(4): 470-477
- URL: https://www.wjgnet.com/1007-9327/full/v17/i4/470.htm
- DOI: https://dx.doi.org/10.3748/wjg.v17.i4.470


