Copyright
©2011 Baishideng Publishing Group Co.
World J Gastroenterol. Jan 28, 2011; 17(4): 449-458
Published online Jan 28, 2011. doi: 10.3748/wjg.v17.i4.449
Published online Jan 28, 2011. doi: 10.3748/wjg.v17.i4.449
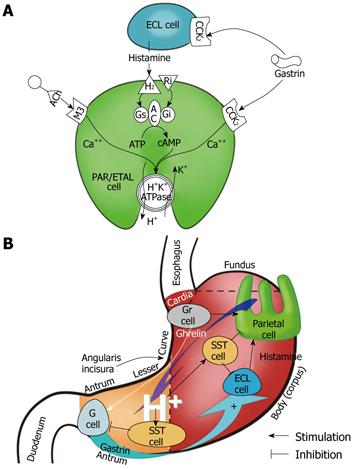
Figure 1 Gastric secretory mechanism at the parietal cell (oxyntic) level (A) and at the level of the whole stomach (B).
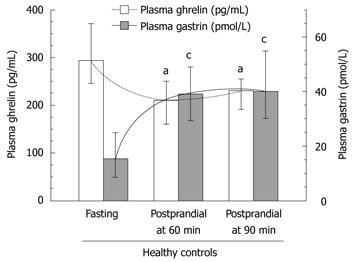
Figure 2 Plasma ghrelin and gastrin concentrations in healthy subjects under fasting and postprandial conditions at 60 and 90 min after a meal.
Median values (with range). “a” and “c“ indicates significant (P < 0.05) change compared to fasting ghrelin or gastrin plasma concentrations.
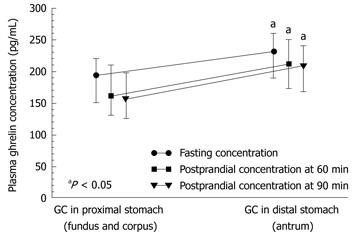
Figure 3 Median values (and range) of fasting and postprandial plasma ghrelin concentrations recorded in patients with gastric cancer localized in the proximal versus distal stomach.
“a” indicates significant (aP < 0.05) increase above the ghrelin levels in gastric cancer (GC) localized in proximal stomach.
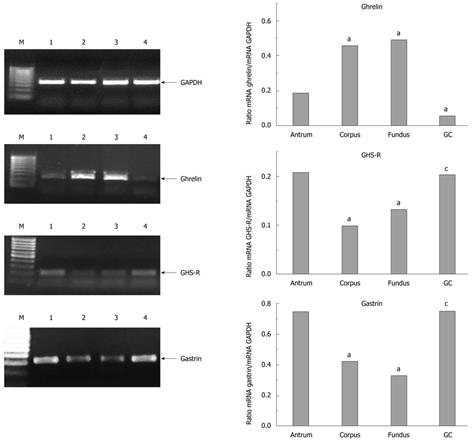
Figure 4 mRNA expression in mucosal and cancer tissue for ghrelin, growth hormone secretagogue receptor and gastrin.
“a” indicates significant change in ghrelin, growth hormone secretagogue receptor (GHS-R) and gastrin expression as compared to that in the antral mucosa. “c” indicates significant change in the hormone expression in gastric cancer (GC) tissue compared to that in intact gastric mucosa. M: Marker; 1: Antrum; 2: Corpus; 3: Fundus; 4: GC.
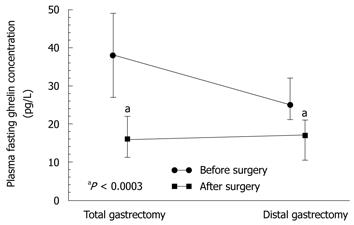
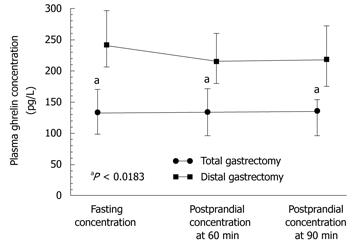
Figure 5 Plasma ghrelin concentrations in total and distal gastrectomy patients.
“a” indicates significantly (P < 0.05) lower values recorded after total gastrectomy when compared to those recorded after distal gastrectomy.
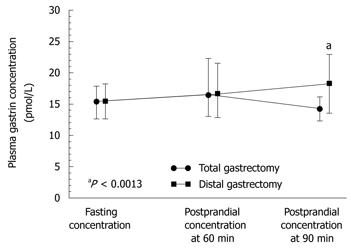
Figure 6 Plasma levels of gastrin under fasting conditions and postprandially (at 60 and 90 min after a meal) in patients after total or distal gastrectomy.
“a” indicates significant difference (P < 0.05) compared to fasting level.
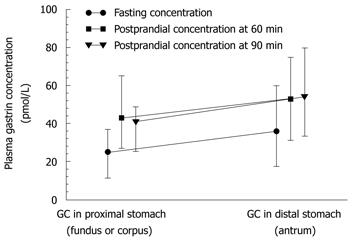
Figure 7 Plasma gastrin levels (median and range) under fasting and postprandial conditions (at 60 and 90 min after a meal) in patients with gastric cancer located in fundus and beyond the fundus (distal stomach).
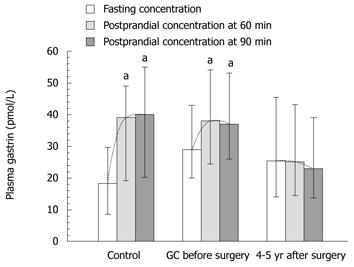
Figure 8 Plasma gastrin levels under fasting and postprandial conditions (at 60 and 90 min after a meal) in healthy controls, gastric cancer patients and patients after 4-5 yr of gastrectomy patients due to gastric cancer.
(Medians and range). “a” indicates significant change (P < 0.05) compared to fasting level. GC: Gastric cancer
Figure 9 Plasma gastrin concentrations under fasting conditions and postprandially at 60 and 90 min after food intake in gastric cancer patients after total or distal gastrectomy.
“a” indicates significant difference (P < 0.05) compared to values recorded before the surgery.
- Citation: Zub-Pokrowiecka A, Rembiasz K, Konturek PC, Budzyński A, Konturek SJ, Winiarski M, Bielański W. Ghrelin and gastrin in advanced gastric cancer before and after gastrectomy. World J Gastroenterol 2011; 17(4): 449-458
- URL: https://www.wjgnet.com/1007-9327/full/v17/i4/449.htm
- DOI: https://dx.doi.org/10.3748/wjg.v17.i4.449


