Copyright
©2011 Baishideng Publishing Group Co.
World J Gastroenterol. Jan 21, 2011; 17(3): 300-312
Published online Jan 21, 2011. doi: 10.3748/wjg.v17.i3.300
Published online Jan 21, 2011. doi: 10.3748/wjg.v17.i3.300
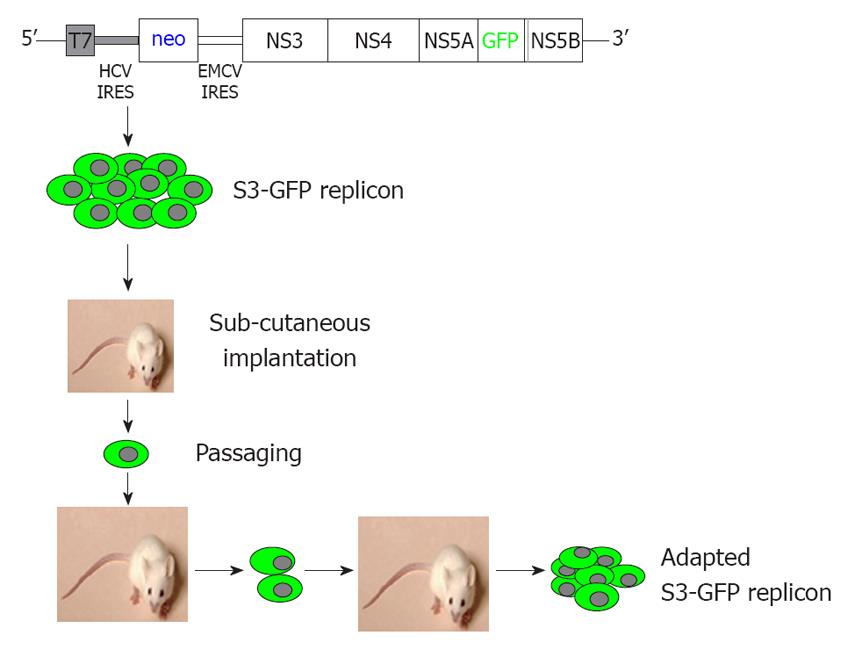
Figure 1 Summary of overall experimental plan to generate a mouse-adapted hepatitis C virus-green fluorescence protein replicon cell line.
A chimeric replicon clone was prepared by inserting the green fluorescence protein (GFP) coding sequences with the NS5A sequences of the hepatitis C virus (HCV) sub-genomic clone. Huh-7 cells were transfected with a transcribed sub-genomic HCV-RNA replicon. A stable Huh-7 cell line with replicating HCV GFP chimera RNA (S3-GFP replicon) was developed. The replicon cell line was implanted in SCID mice for tumor development. Subcutaneous tumor that developed in SCID mice was collected and cells with replicating HCV-GFP were selected by culture in growth medium that contained G-418 (1 mg/mL). The in vivo adaptation process was repeated to generate a mouse-adapted S3-GFP replicon cell line that demonstrated 50% GFP expression in subcutaneous tumors.
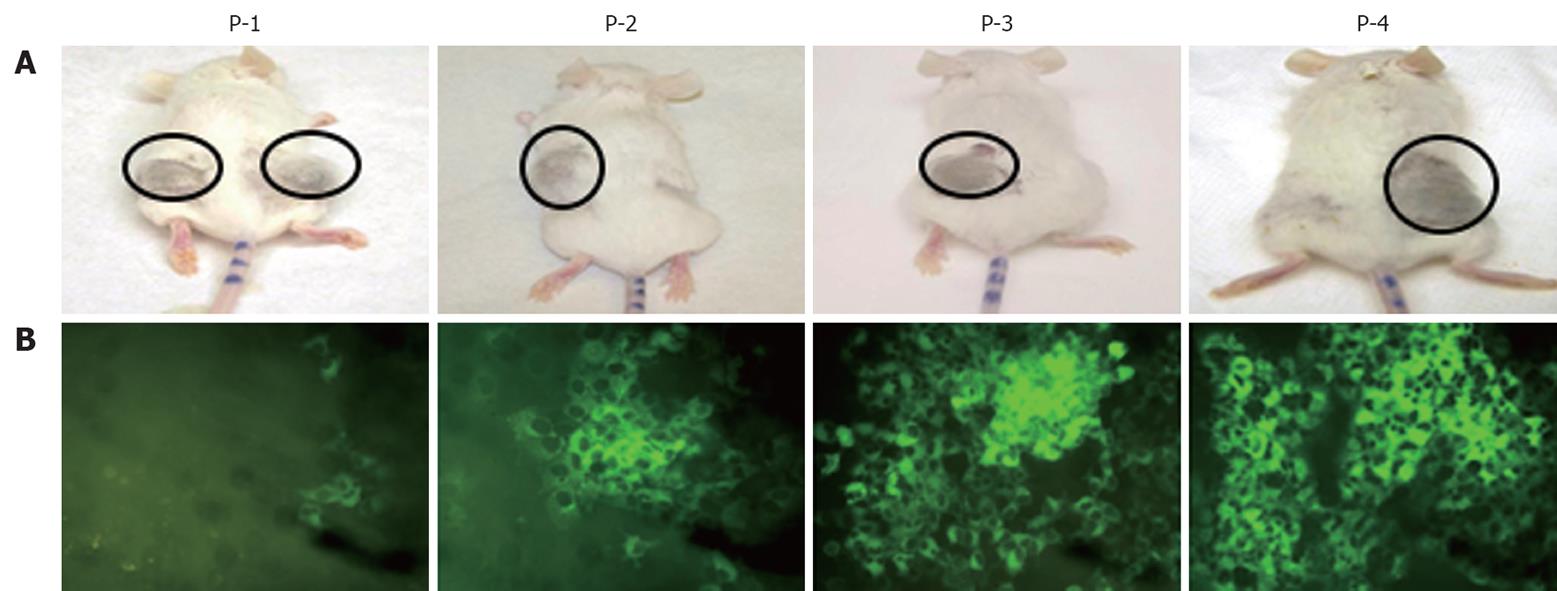
Figure 2 Intracellular expression of hepatitis C virus-green fluorescence protein in the subcutaneous tumor of SCID mice.
Mice were injected subcutaneously with 106 hepatitis C virus-green fluorescence protein (GFP) replicon cells. Tumor growth was monitored on a weekly basis. A: Tumorigenicity of Huh-7 replicon cells in γ-irradiated SCID mice; B: Expression of GFP in tumor cells during the in vivo passage. The number of GFP positive cells was low (< 10%) after the first passage. There was a gradual increase in GFP expression in the subcutaneous tumors after each passage. After four passages, the number of GFP-positive cells increased significantly (> 50%).
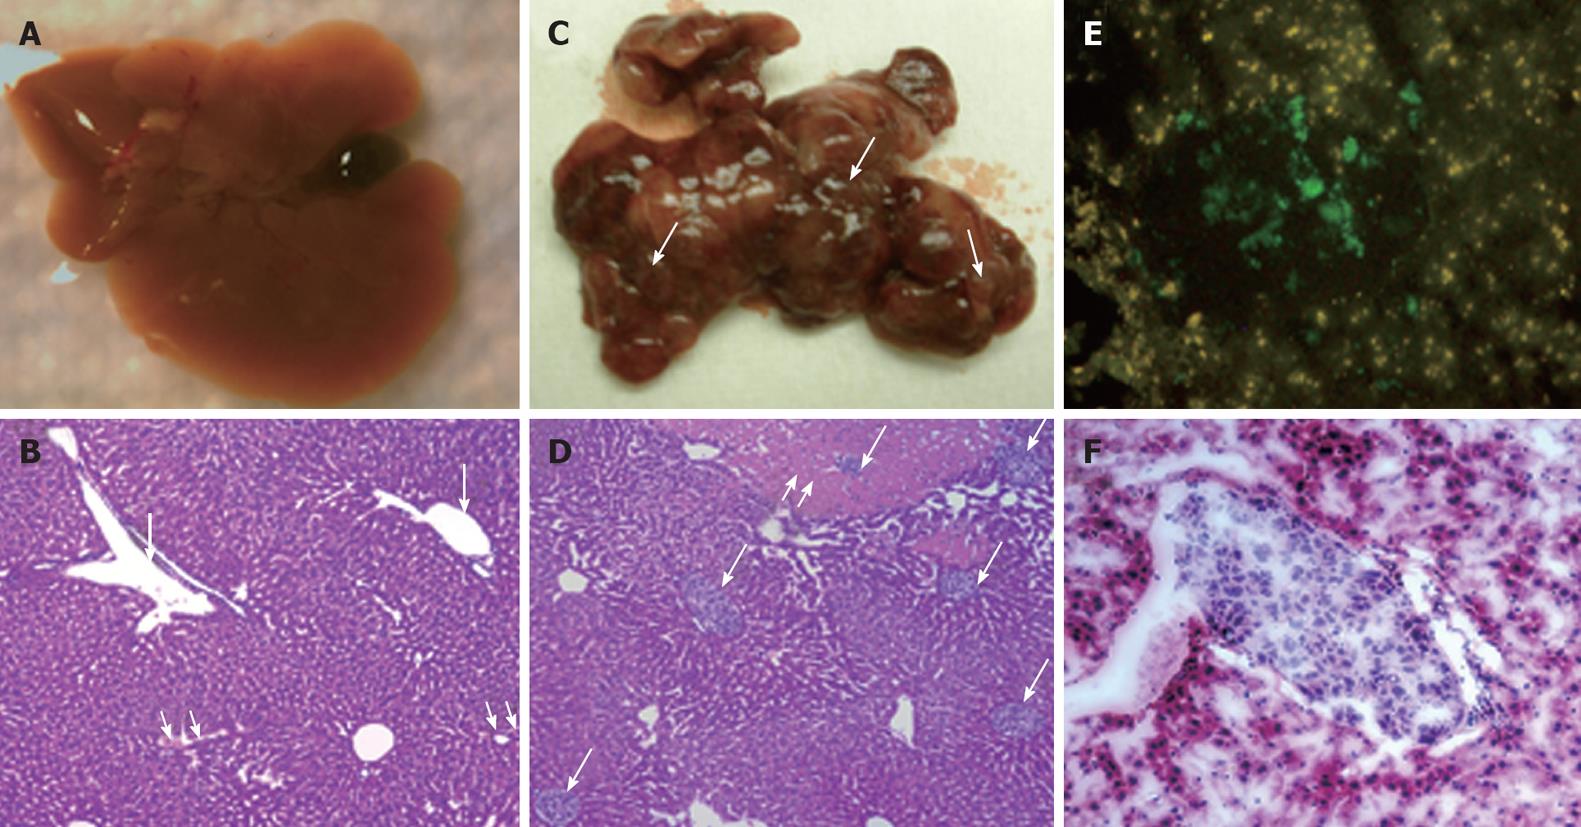
Figure 3 Human hepatocellular carcinoma xenograft in SCID/NOD mouse liver.
A: Gross appearance of normal mouse liver with distended gall bladder; B: Light microscopic appearance of normal liver stained with hematoxylin and eosin (4 × magnification). The portal tracts are shown by single arrows and the central veins are marked with double arrows; C: Gross appearance of mouse liver with metastatic nodules of hepatocellular carcinoma (HCC). Note the distended white-tan areas of metastasis and infarction in the mouse liver (single arrows); D: Microscopic metastasis of HCC diffusely infiltrating the liver through the portal venous system (single arrows). Note the areas of infarction secondary to the tumor emboli in the portal vein (double arrow). Human hepatocytes can be easily discriminated from the mouse hepatocytes by their size and pale color; E: Expression of hepatitis C virus-green fluorescence protein (GFP) fusion protein in the S3-GFP liver tumors in the mouse; F: Hematoxylin and eosin staining (frozen section) of HCC tumor in the mouse liver at 4 wk after intrasplenic infusion of S3-GFP replicon cells.
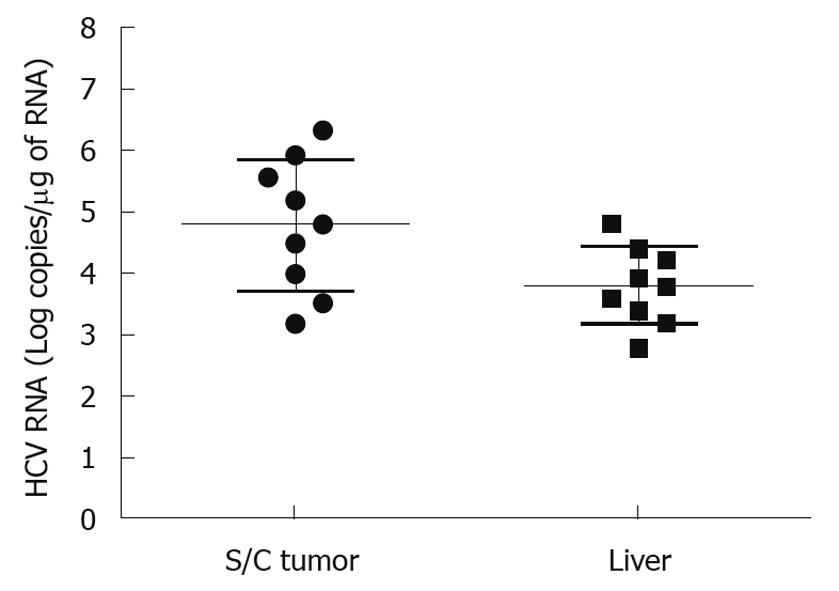
Figure 4 Comparison of hepatitis C virus RNA level between hepatocellular carcinoma xenografts formed subcutaneously and in the liver.
RNA extract was prepared using the GITC method. The hepatitis C virus (HCV) RNA level was measured by real-time polymerase chain reaction using 1 μg total RNA isolated from the tumor samples, and mentioned as log copies/μg RNA. HCV RNA levels were 10-fold higher in the tumors formed subcutaneously compared to those that were formed in the liver. The titer of HCV in the liver tumor model was comparable to that in the infected human liver.
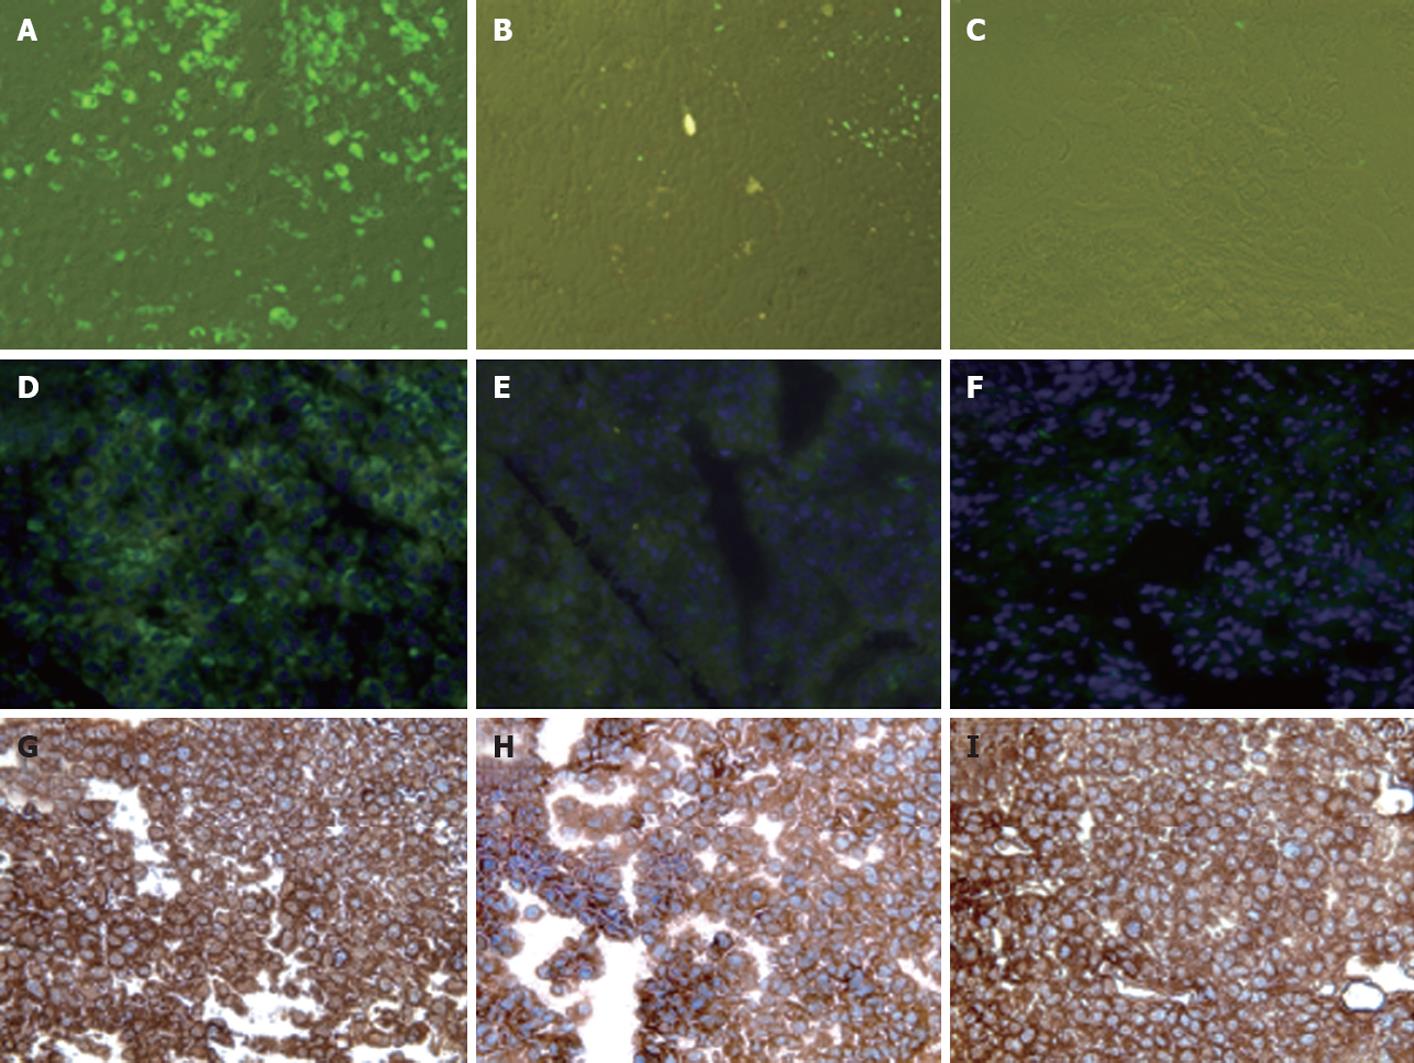
Figure 5 Interferon-α inhibits hepatitis C virus-green fluorescence protein expression in human hepatocellular xenografts formed subcutaneously in SCID mice.
Mouse-adapted replicon cells were injected subcutaneously into SCID mice, which then developed visible tumors after 2 wk. The mice were injected intraperitoneally with a total dose of 15 000 IU interferon-α (IFN-α) in 100-μL volumes, three times weekly. Tumors were harvested after 1 and 2 wk of IFN treatment and examined for green fluorescence protein (GFP) expression and viral RNA by RPA and real-time polymerase chain reaction. A, D: Expression of GFP in the frozen sections of hepatocellular carcinoma (HCC) xenografts before IFN-α treatment; B, E: Expression of GFP 1 wk after IFN-treatment; C, F: Expression of GFP after 2 wk IFN-treatment. The middle panel shows DAPI staining of the nucleus. IFN inhibited hepatitis C virus RNA replication and GFP expression in the liver tumors at 7 and 14 d; G-I: Intracytoplasmic expression of human albumin in the HCC xenografts formed by subcutaneous injection of in vivo adapted Huh-7 replicon cells.
Figure 6 Intracellular hepatitis C virus RNA levels in subcutaneous tumors.
A: RPA measuring intracellular hepatitis C virus (HCV) RNA levels in hepatocellular xenografts formed subcutaneously. There was a gradual increase in HCV RNA levels in the subcutaneous tumors at 3, 7 and 14 d post-tumor development. Two weeks of interferon (IFN) treatment completely inhibited HCV RNA replication in the subcutaneous tumors, as demonstrated by a negative RPA signal at 14 d of IFN-α treatment; B: Real-time reverse transcription polymerase chain reaction showing HCV RNA levels in the subcutaneous tumors before and after IFN-α treatment. IFN treatment decreased HCV RNA levels in the tumors, which remained below the detection limits after 2 wk.
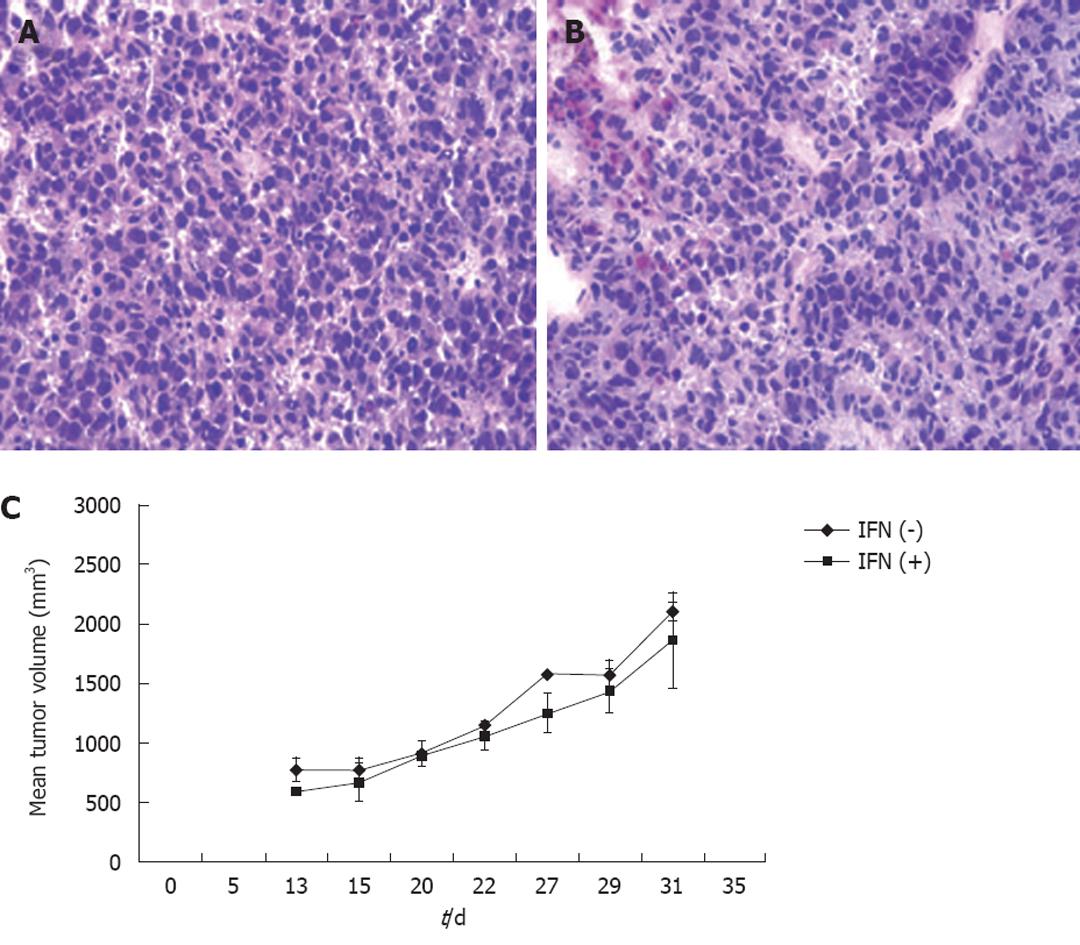
Figure 7 Interferon treatment has no effect of tumor growth in SCID/bg mice.
A, B: Histology of tumor sections of experimental mice before (A) and after (B) 2 wk of interferon-α (IFN-α) treatment showed no evidence of tumor cell necrosis or apoptosis (10 × magnification); C: Kinetics of tumor growth between two groups of mice during IFN-α treatment. The mean tumor volume remained the same between these two groups of mice.
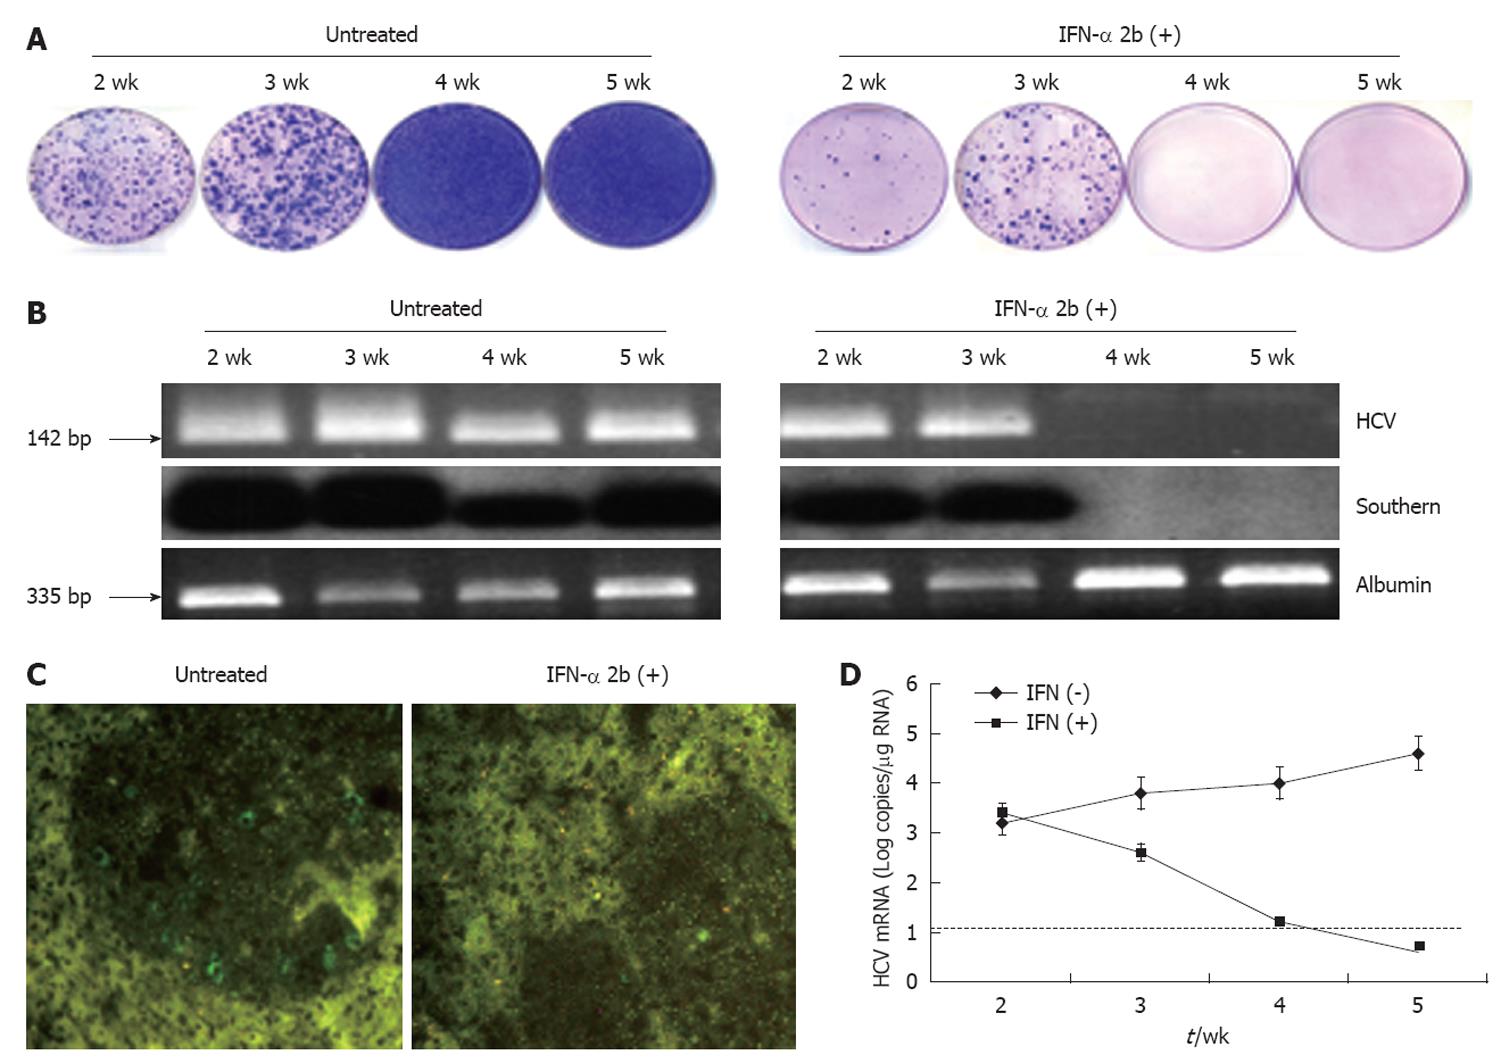
Figure 8 Antiviral effect of interferon-α in the liver tumor model.
S3-green fluorescence protein (GFP) cells were implanted in the liver of NOD/SCID mice by intrasplenic injection. After 3 wk, interferon-α (IFN-α) treatment was started. The time shown represents the weeks after IFN treatment. A: Colony assay of viable tumor cells isolated from the liver tumor model at different time points with or without IFN-α treatment. Tumor cells isolated from the entire mouse liver were cultured in the medium that contained 1 mg/mL G-418. The replicon cells with hepatitis C virus (HCV) survived the treatment and formed cell colonies. Left panel: there was an increase in the number of cell colonies between 4 and 5 wk. Right panel: IFN-α treatment completely inhibited HCV replication and cell colony formation at 4 wk; B: RT-nested polymerase chain reaction (PCR) and Southern blot analysis for HCV and albumin in the RNA extracts of the liver tumor. Left panel shows the results without treatment. Right panel shows IFN-α treatment; C: Expression of HCV-GFP in the liver tumors before and after IFN treatment. IFN treatment after 4 wk completely inhibited HCV-GFP expression in the S3-GFP tumors in the SCID mouse liver; D: Real-time reverse transcription PCR (RT-PCR) showed that the levels of HCV in the liver tumor remained undetected after 4 wk of IFN-α treatment. The dotted line indicates the limit of detection for real time RT-PCR assay.
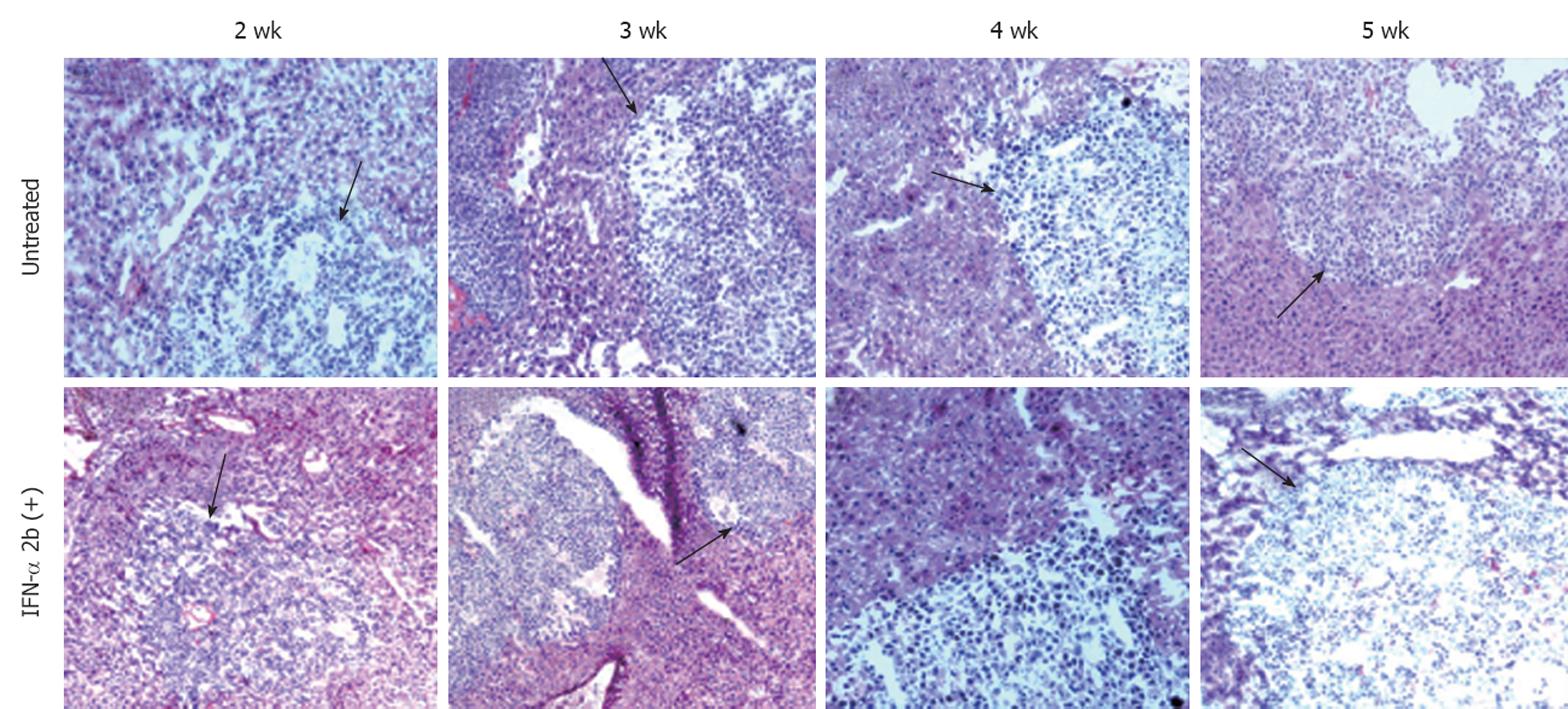
Figure 9 Histological evaluation of liver sections after hematoxylin and eosin staining that indicates that interferon-α treatment did not cause any tumor necrosis or reduce the size of tumor nodules in the SCID mice liver.
The upper panel shows the untreated mouse liver sections after 2-5 wk of tumor development. The black arrows indicate the hepatocellular carcinoma (HCC) tumor in the mouse liver. Similarly, the lower panel shows the interferon-α-treated mouse liver sections with HCC tumor at different time points (10 × magnification).
- Citation: Hazari S, Hefler HJ, Chandra PK, Poat B, Gunduz F, Ooms T, Wu T, Balart LA, Dash S. Hepatocellular carcinoma xenograft supports HCV replication: A mouse model for evaluating antivirals. World J Gastroenterol 2011; 17(3): 300-312
- URL: https://www.wjgnet.com/1007-9327/full/v17/i3/300.htm
- DOI: https://dx.doi.org/10.3748/wjg.v17.i3.300


