Copyright
©2011 Baishideng Publishing Group Co.
World J Gastroenterol. Jul 7, 2011; 17(25): 3035-3042
Published online Jul 7, 2011. doi: 10.3748/wjg.v17.i25.3035
Published online Jul 7, 2011. doi: 10.3748/wjg.v17.i25.3035
Figure 1 Kaplan-Meier curves of time to first fracture for patients according to clinical presentation in celiac disease patients and matched control population before the time of celiac disease diagnosis.
A : Classic presentation celiac disease (CD) patients; B: Atypical/silent presentation CD patients. HR: Hazard ratio; NS: Not significant.
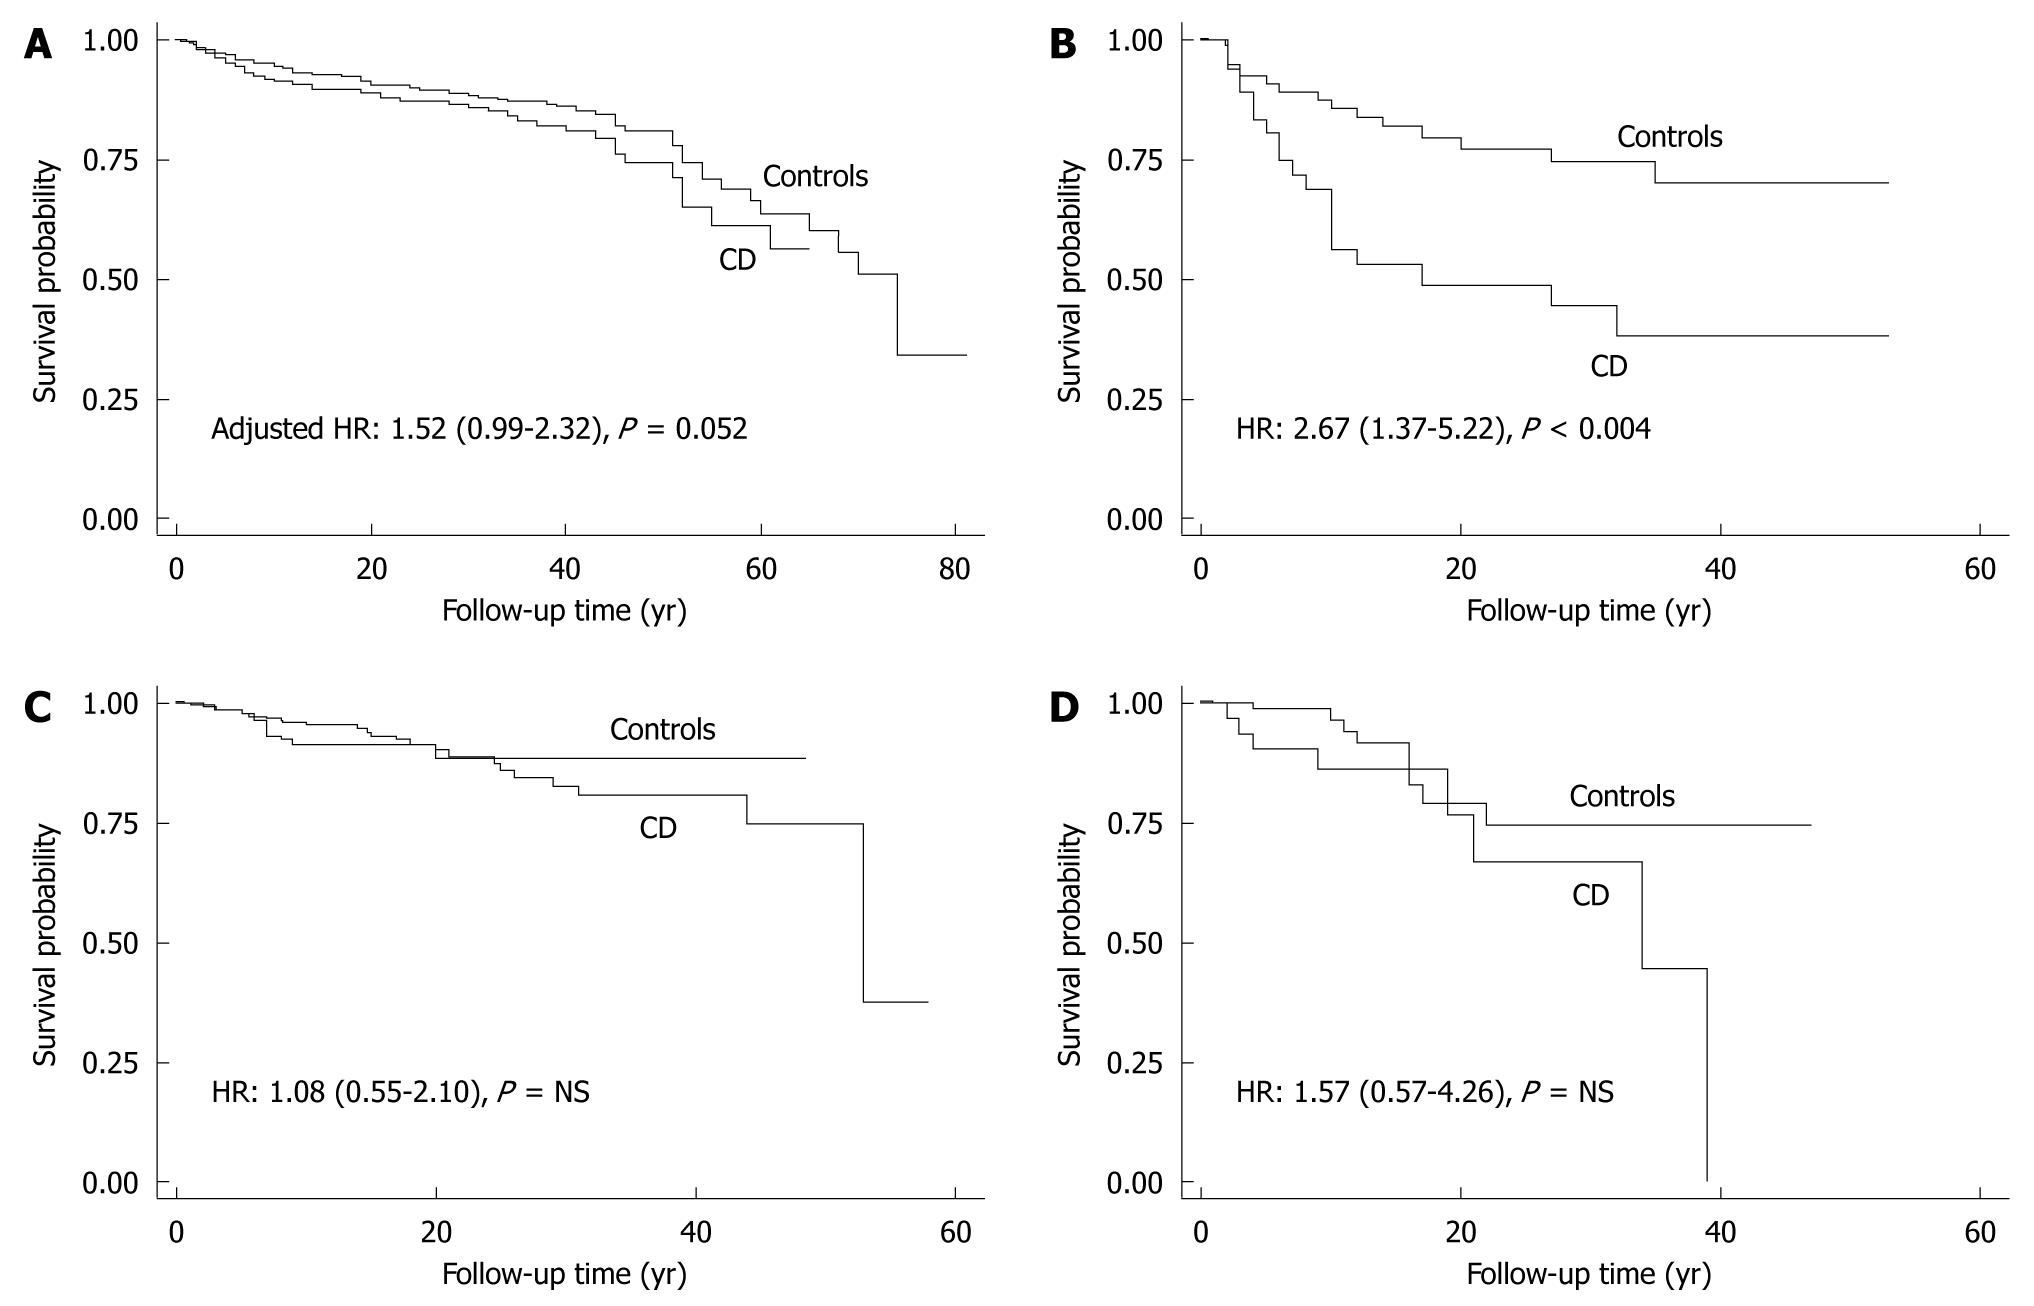
Figure 2 Kaplan-Meier curves showing time of first fracture according to gender in celiac disease population versus control group.
A: Females before diagnosis; B: Males before diagnosis; C: Females after diagnosis; D: Males after diagnosis. CD: Celiac disease; HR: Hazard ratio; NS: Not significant.
- Citation: Sánchez MIP, Mohaidle A, Baistrocchi A, Matoso D, Vázquez H, González A, Mazure R, Maffei E, Ferrari G, Smecuol E, Crivelli A, Paula JA, Gómez JC, Pedreira S, Mauriño E, Bai JC. Risk of fracture in celiac disease: Gender, dietary compliance, or both? World J Gastroenterol 2011; 17(25): 3035-3042
- URL: https://www.wjgnet.com/1007-9327/full/v17/i25/3035.htm
- DOI: https://dx.doi.org/10.3748/wjg.v17.i25.3035


