Copyright
©2011 Baishideng Publishing Group Co.
World J Gastroenterol. Jul 7, 2011; 17(25): 3002-3011
Published online Jul 7, 2011. doi: 10.3748/wjg.v17.i25.3002
Published online Jul 7, 2011. doi: 10.3748/wjg.v17.i25.3002
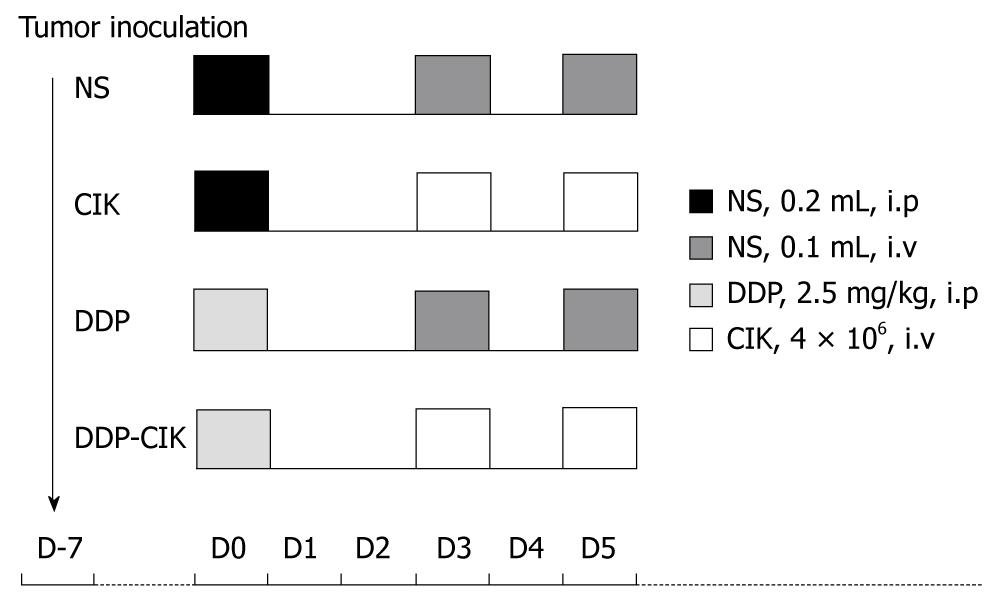
Figure 1 Treatment scheme.
BALB/c WT or BALB/c nu/nu mice were injected s.c with 1 × 10⁶ CT-26 cells on Day 7 and were treated with the respective regimens according to the treatment scheme. Group cytokine-induced killer cells (CIK) received two i.v infusions of 4 × 10⁶ CIK cells at a 1-d interval; Group cisplatin (DDP) was treated with DDP (2.5 mg/kg, i.p); Group DDP-CIK was given preconditioning DDP followed by infusions of CIK cells 3 d later; Group normal saline (NS) was treated with normal saline as control.
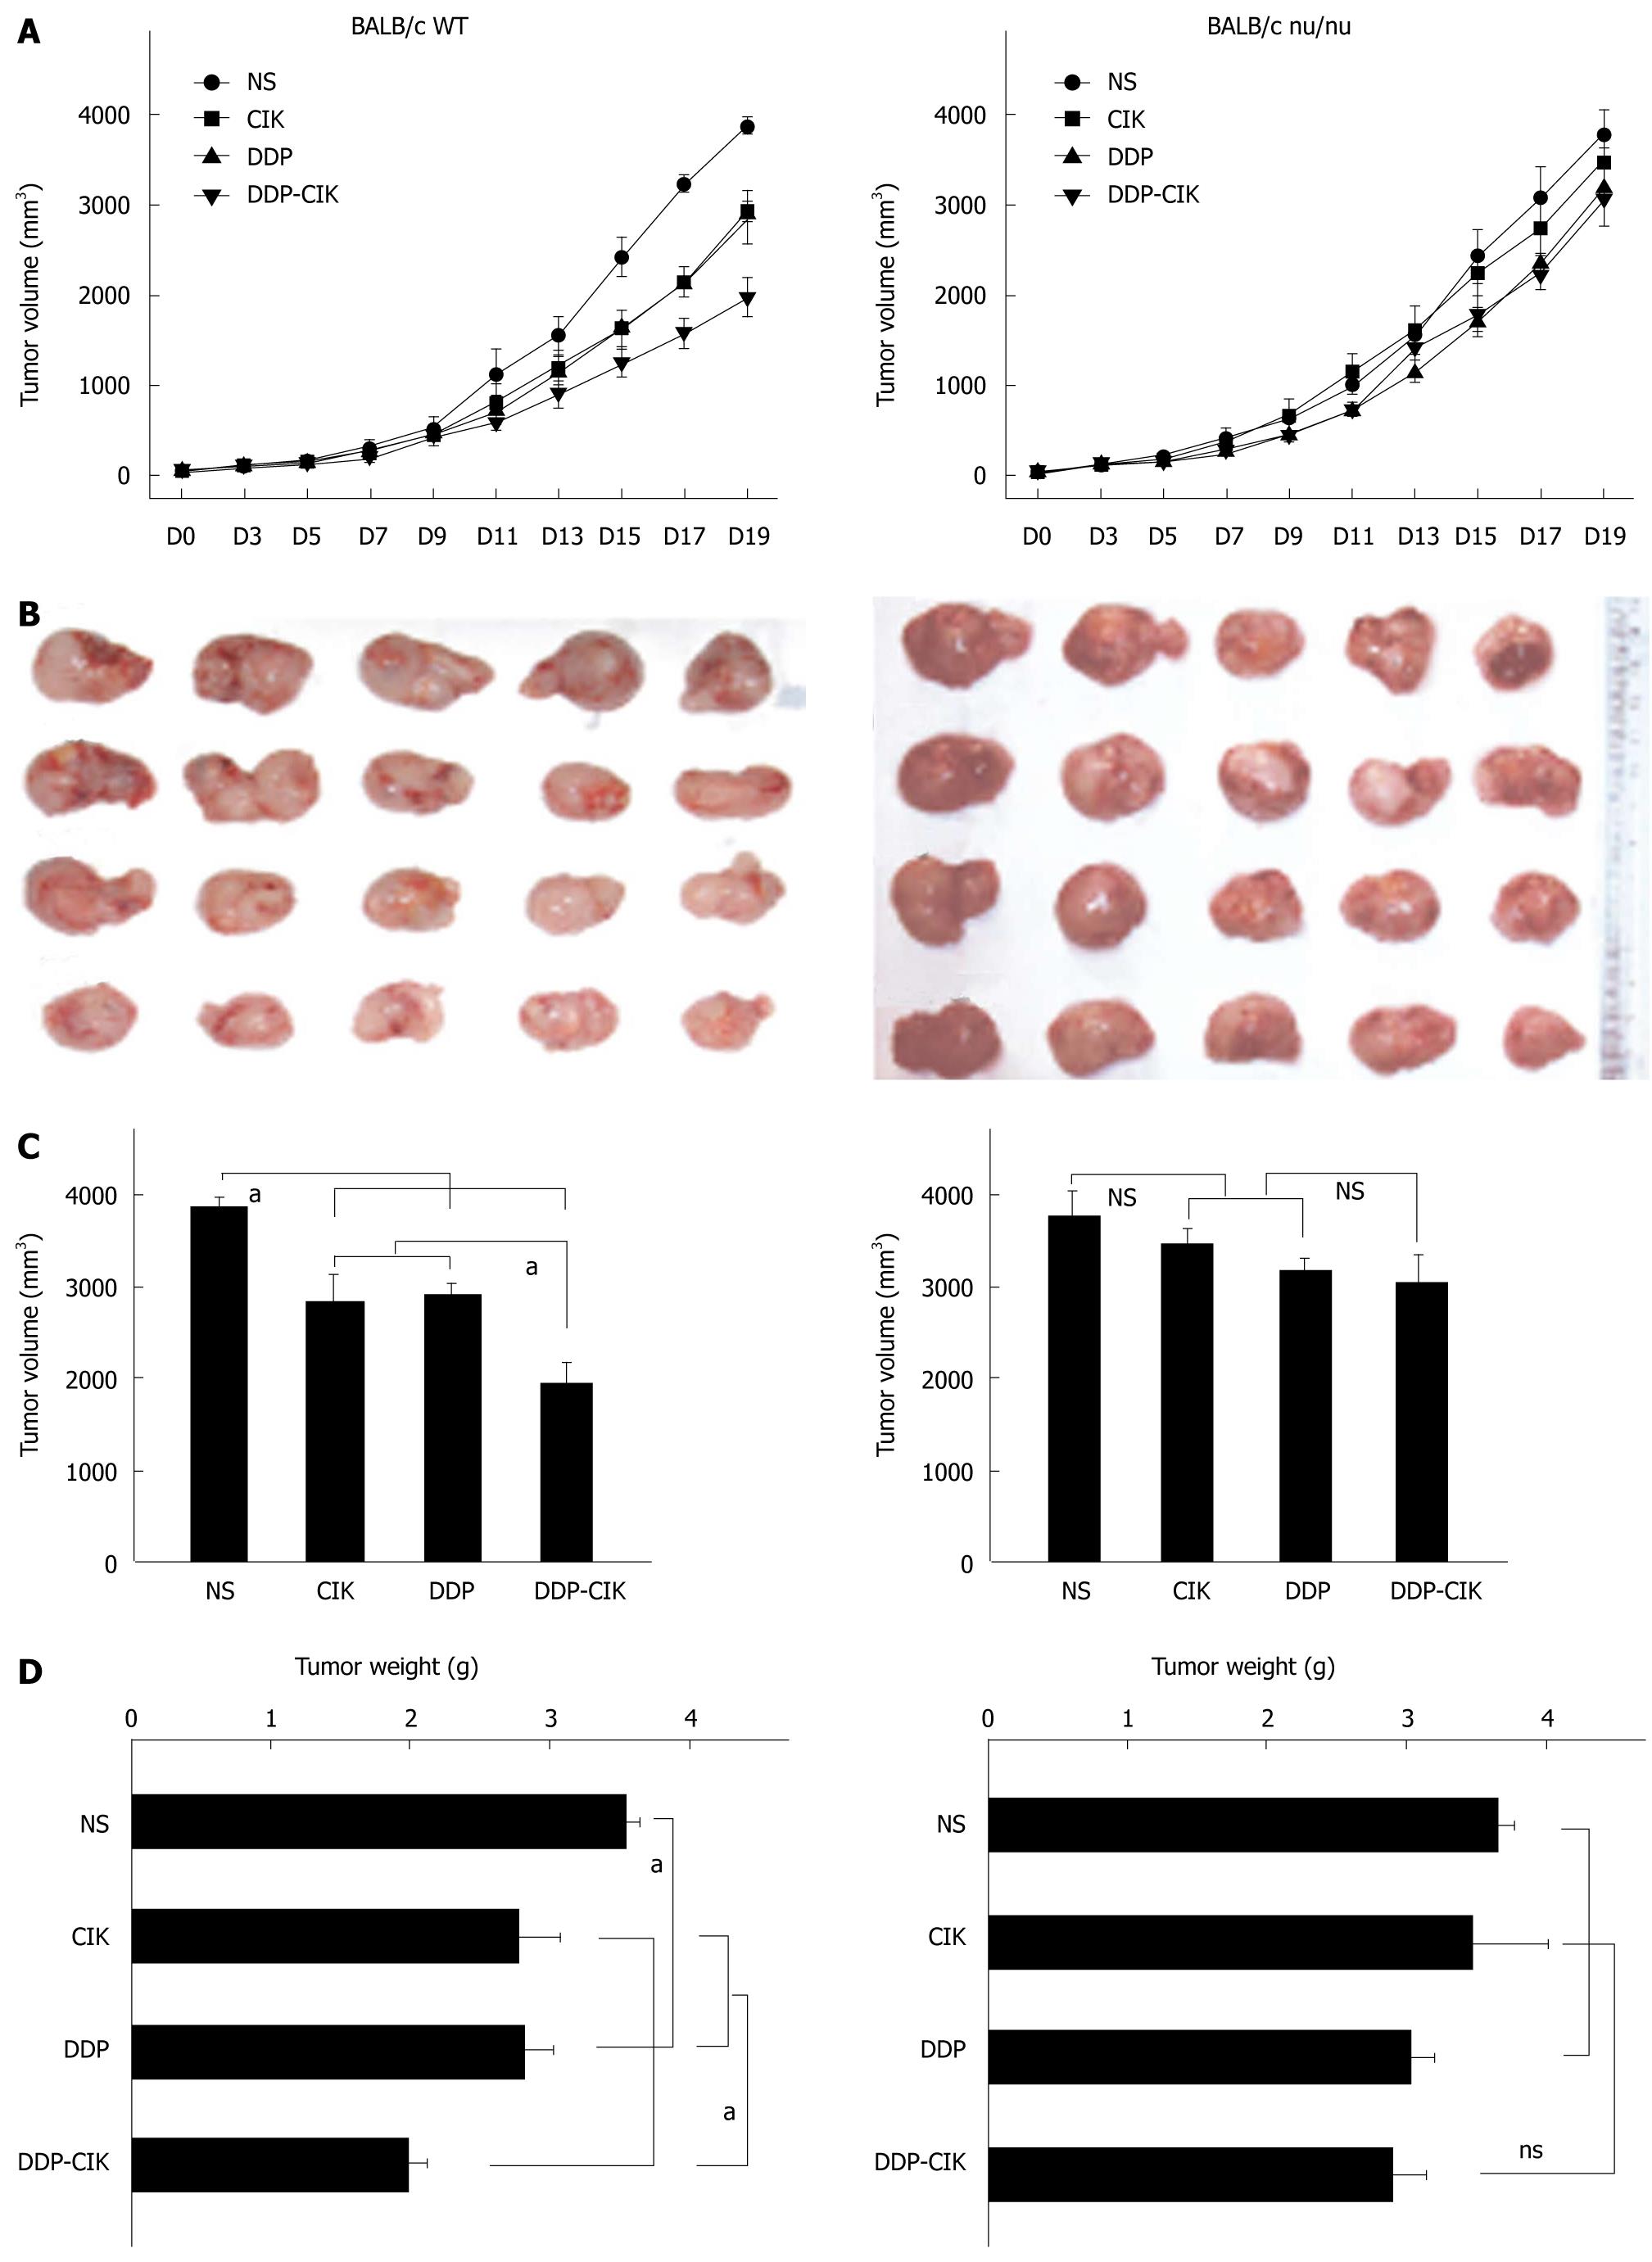
Figure 2 Anti-tumor effect of cisplatin and cytokine-induced killer cells therapy in BALB/c WT and nude mice.
BALB/c WT and BALB/C nu/nu mice were inoculated s.c. with 1 × 10⁶ CT-26 cells on Day 7 and treated according to the treatment scheme. Tumor size was monitored every other day (A). On Day 19, the tumors were isolated (B), and tumor volume (C) and weight (D) were measured. The results for BALB/c WT mice are shown in the left panel of each figure, while the results for nude mice are shown in the right panel. Points and columns : mean tumor volume or weight (n = 5); Bars: SE. aP < 0.05.
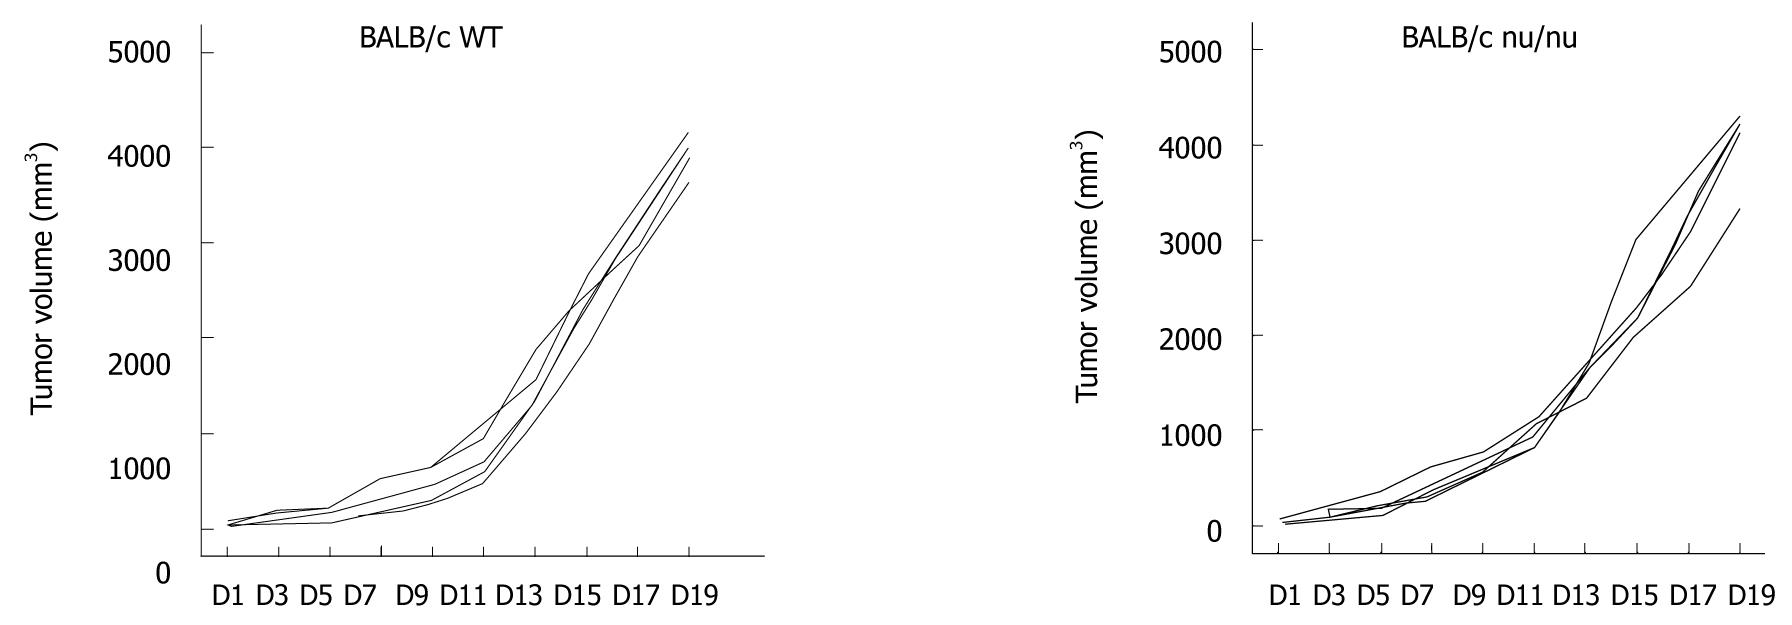
Figure 3 Intrinsic tumor growth pattern of CT-26 carcinomas in untreated BALB/c WT and nude mice.
BALB/c WT (wild type) and BALB/c nu/nu mice were inoculated s.c with 1 × 10⁶ CT-26 cells on Day 7 and tumor size was monitored every other day. The inherent growth patterns in both strains of mice are shown. Each line represents tumor growth in a single mouse.
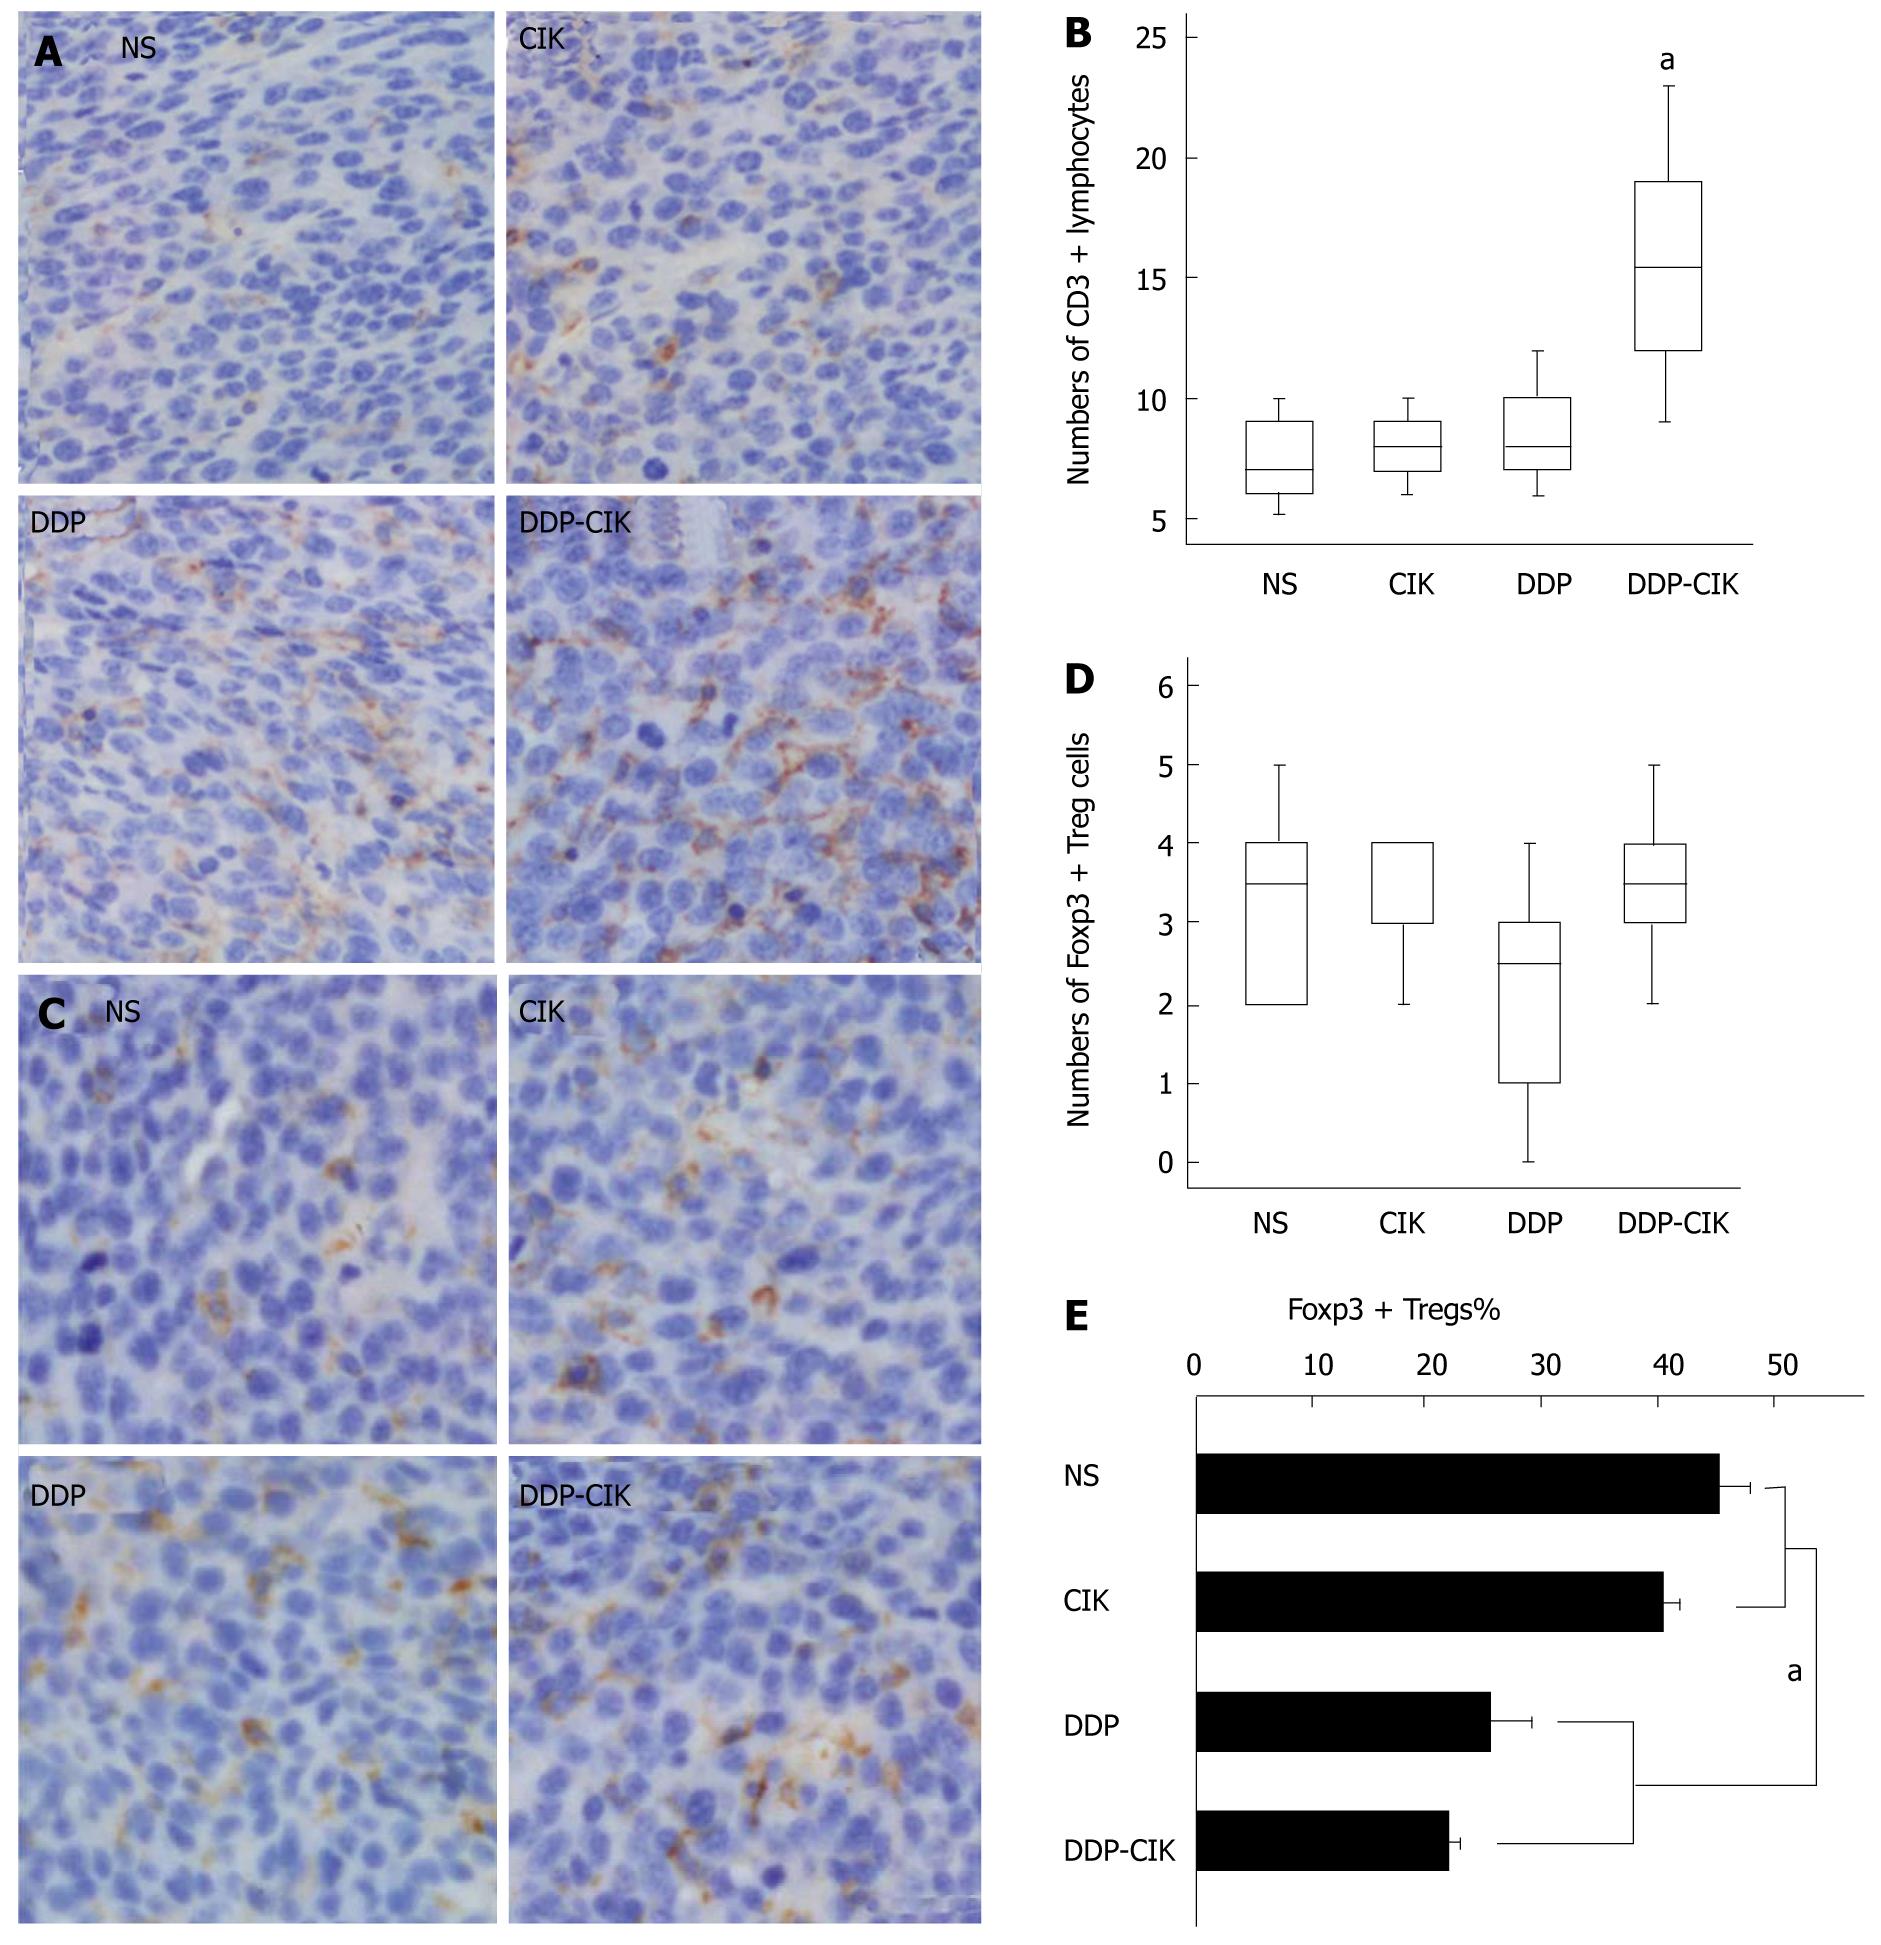
Figure 4 Intratumoral infiltration of lymphocytes after combined therapy.
BALB/c WT mice were injected s.c. with 1 × 10⁶ CT-26 cells and the treatment protocols were initiated 7 d later. On Day 19, consecutive tumor sections were prepared and analyzed by CD3 (A) and FoxP3 (C) staining. Ten individual fields (0.16 mm2) surrounding the apoptotic area (× 400 magnification) were chosen to count the number of intratumoral CD3+ T lymphocytes (B), and to determine the absolute number (D), and percentage (E) of FoxP3 + Treg cells. Experimental groups consisted of five mice per group. Representative sections from all groups are shown. Scale bar: 25 μm. Lines: median; Boxes:75% percentile; Bars (B, D) : SD. Columns : Mean Treg percentage; Bars (E): SE. aP < 0.05. NS: Normal saline; CIK: Cytokine-induced killer cells; DDP: Cisplatin.
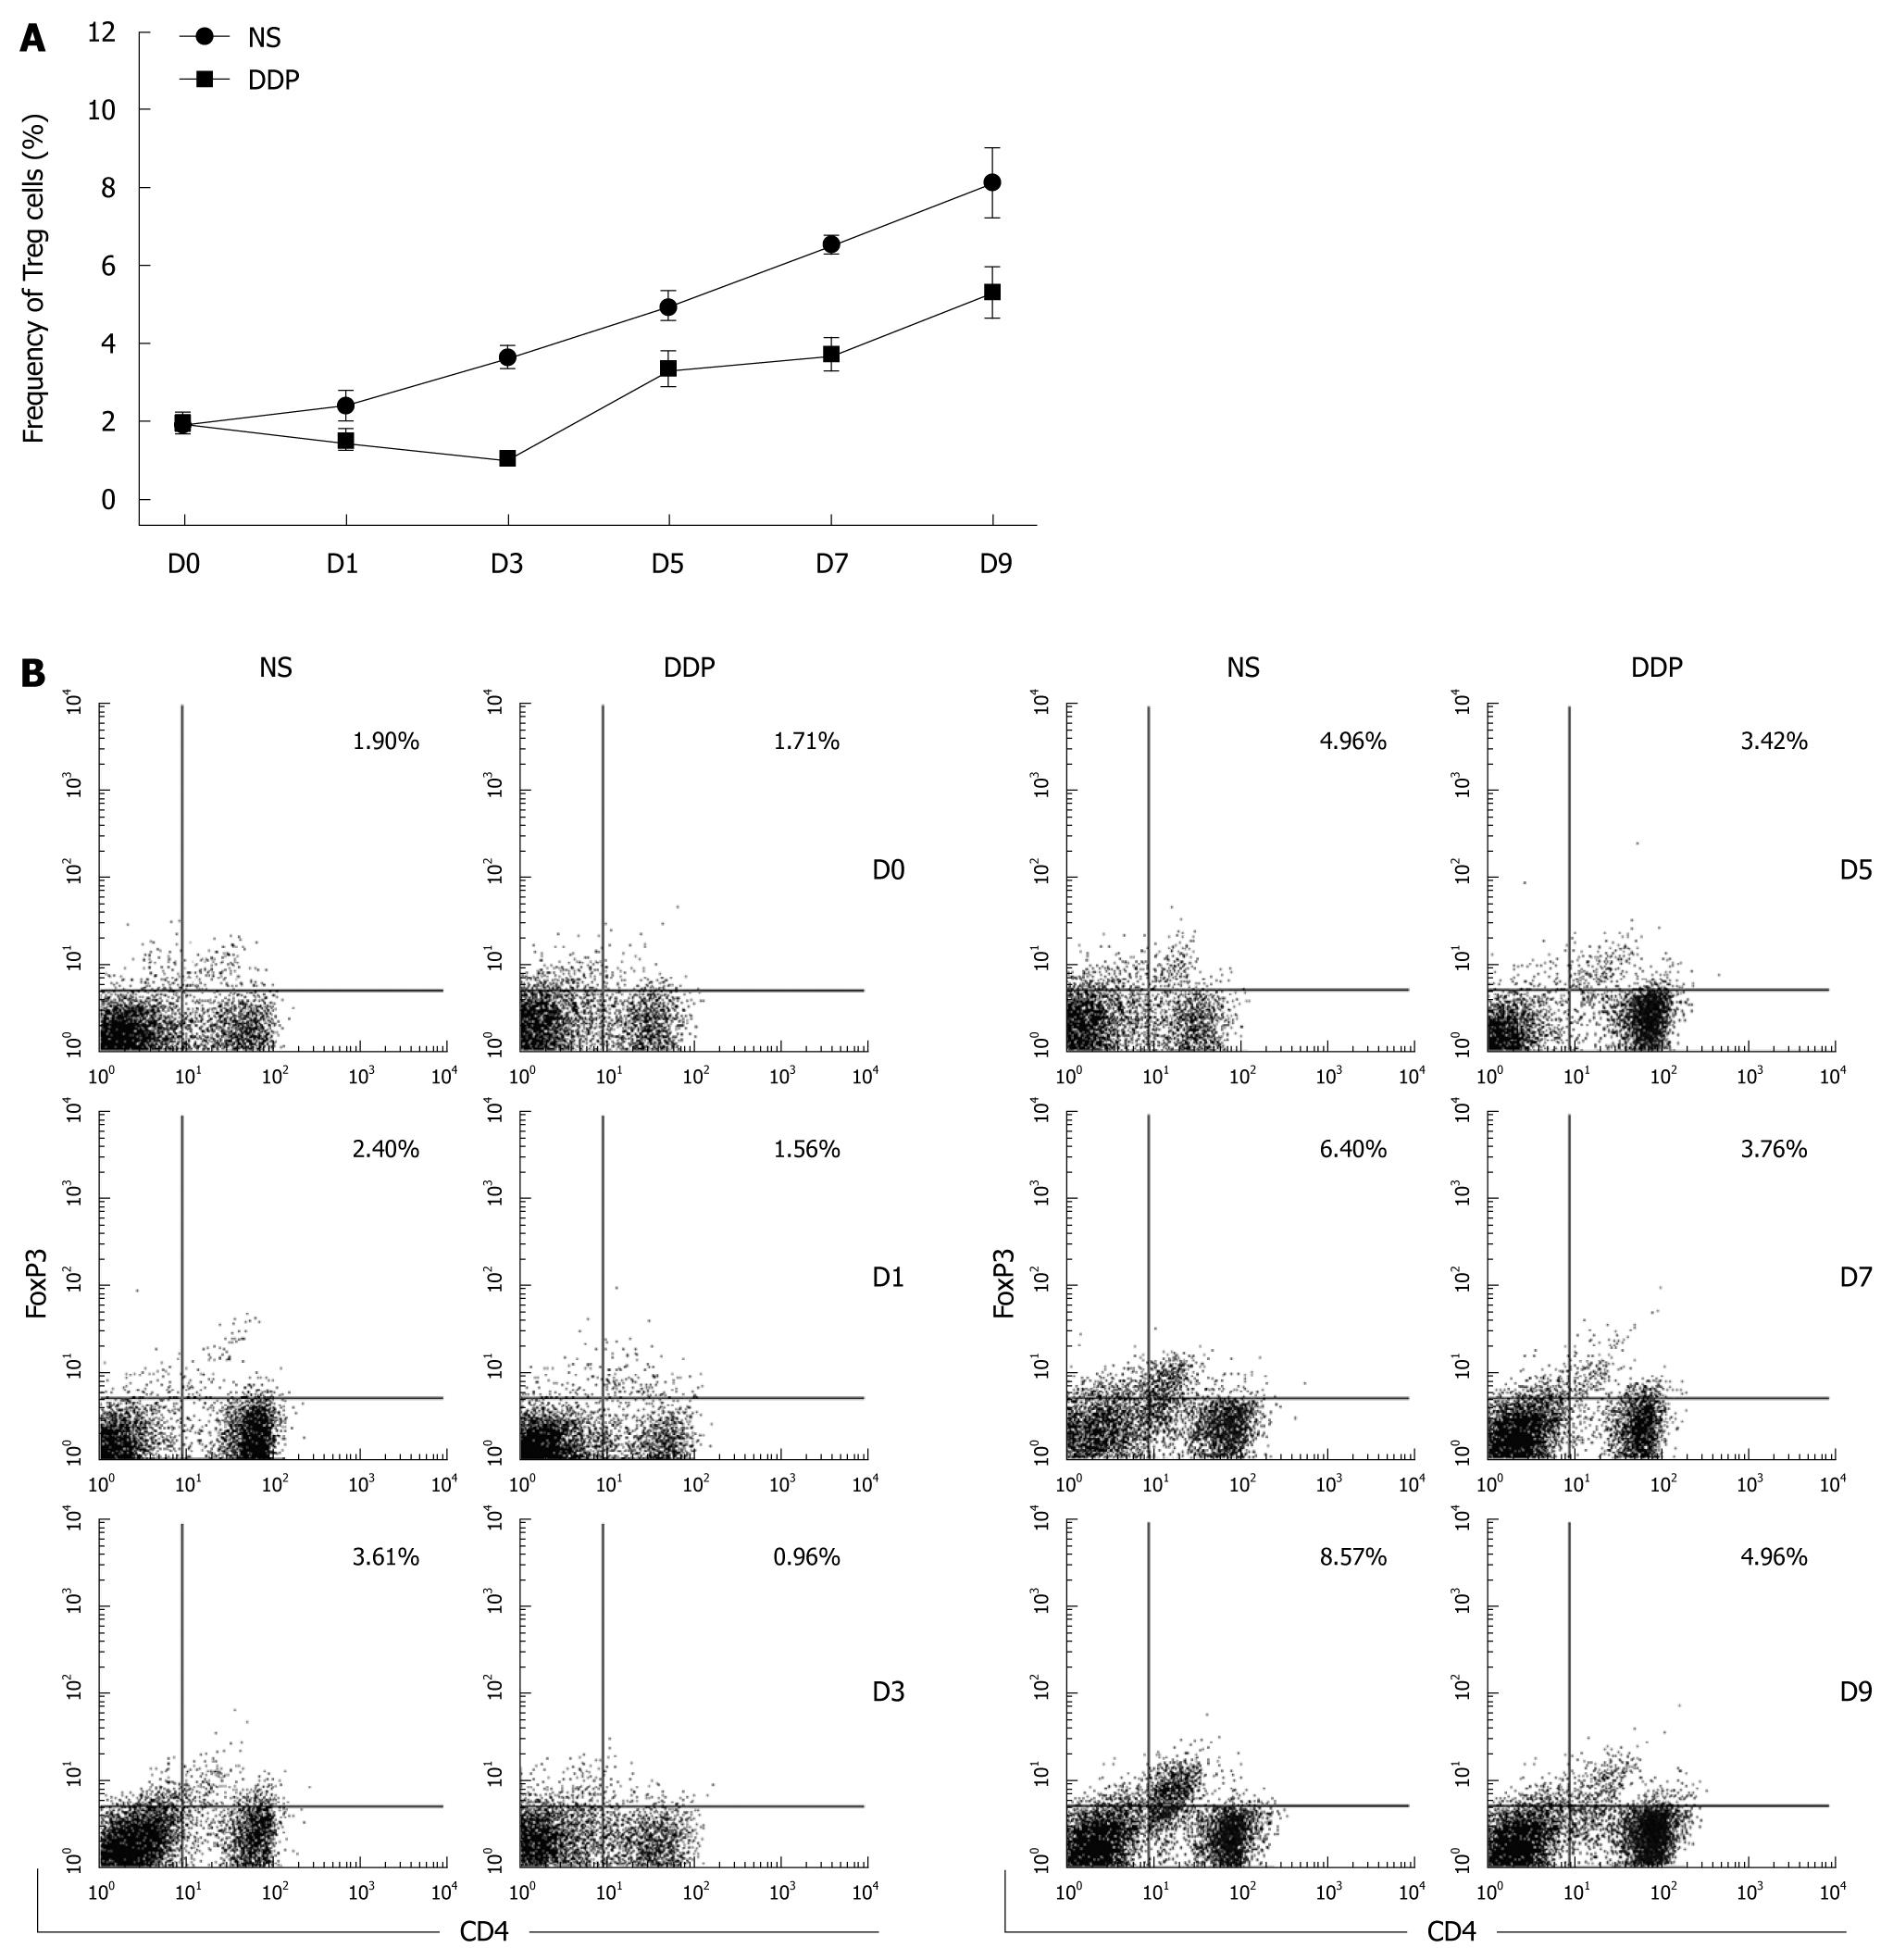
Figure 5 Dynamic changes in the percentage of splenic Tregs after cisplatin (DDP) administration.
BALB/c WT mice were injected s.c. with 1 × 10⁶ CT-26 cells 7 d before treatment. The tumor-bearing mice were treated with DDP (2.5 mg/kg, i.p., D0) and the spleen single cell suspensions prepared to analyze the Treg percentage by flow cytometry at the indicated post-treatment time points (A). Typical data from a representative experiment are shown (B). Points: mean Treg cell percentage (n = 3); Bars: SD. All experiments were performed twice with similar results. NS: Normal saline; DDP: Cisplatin.
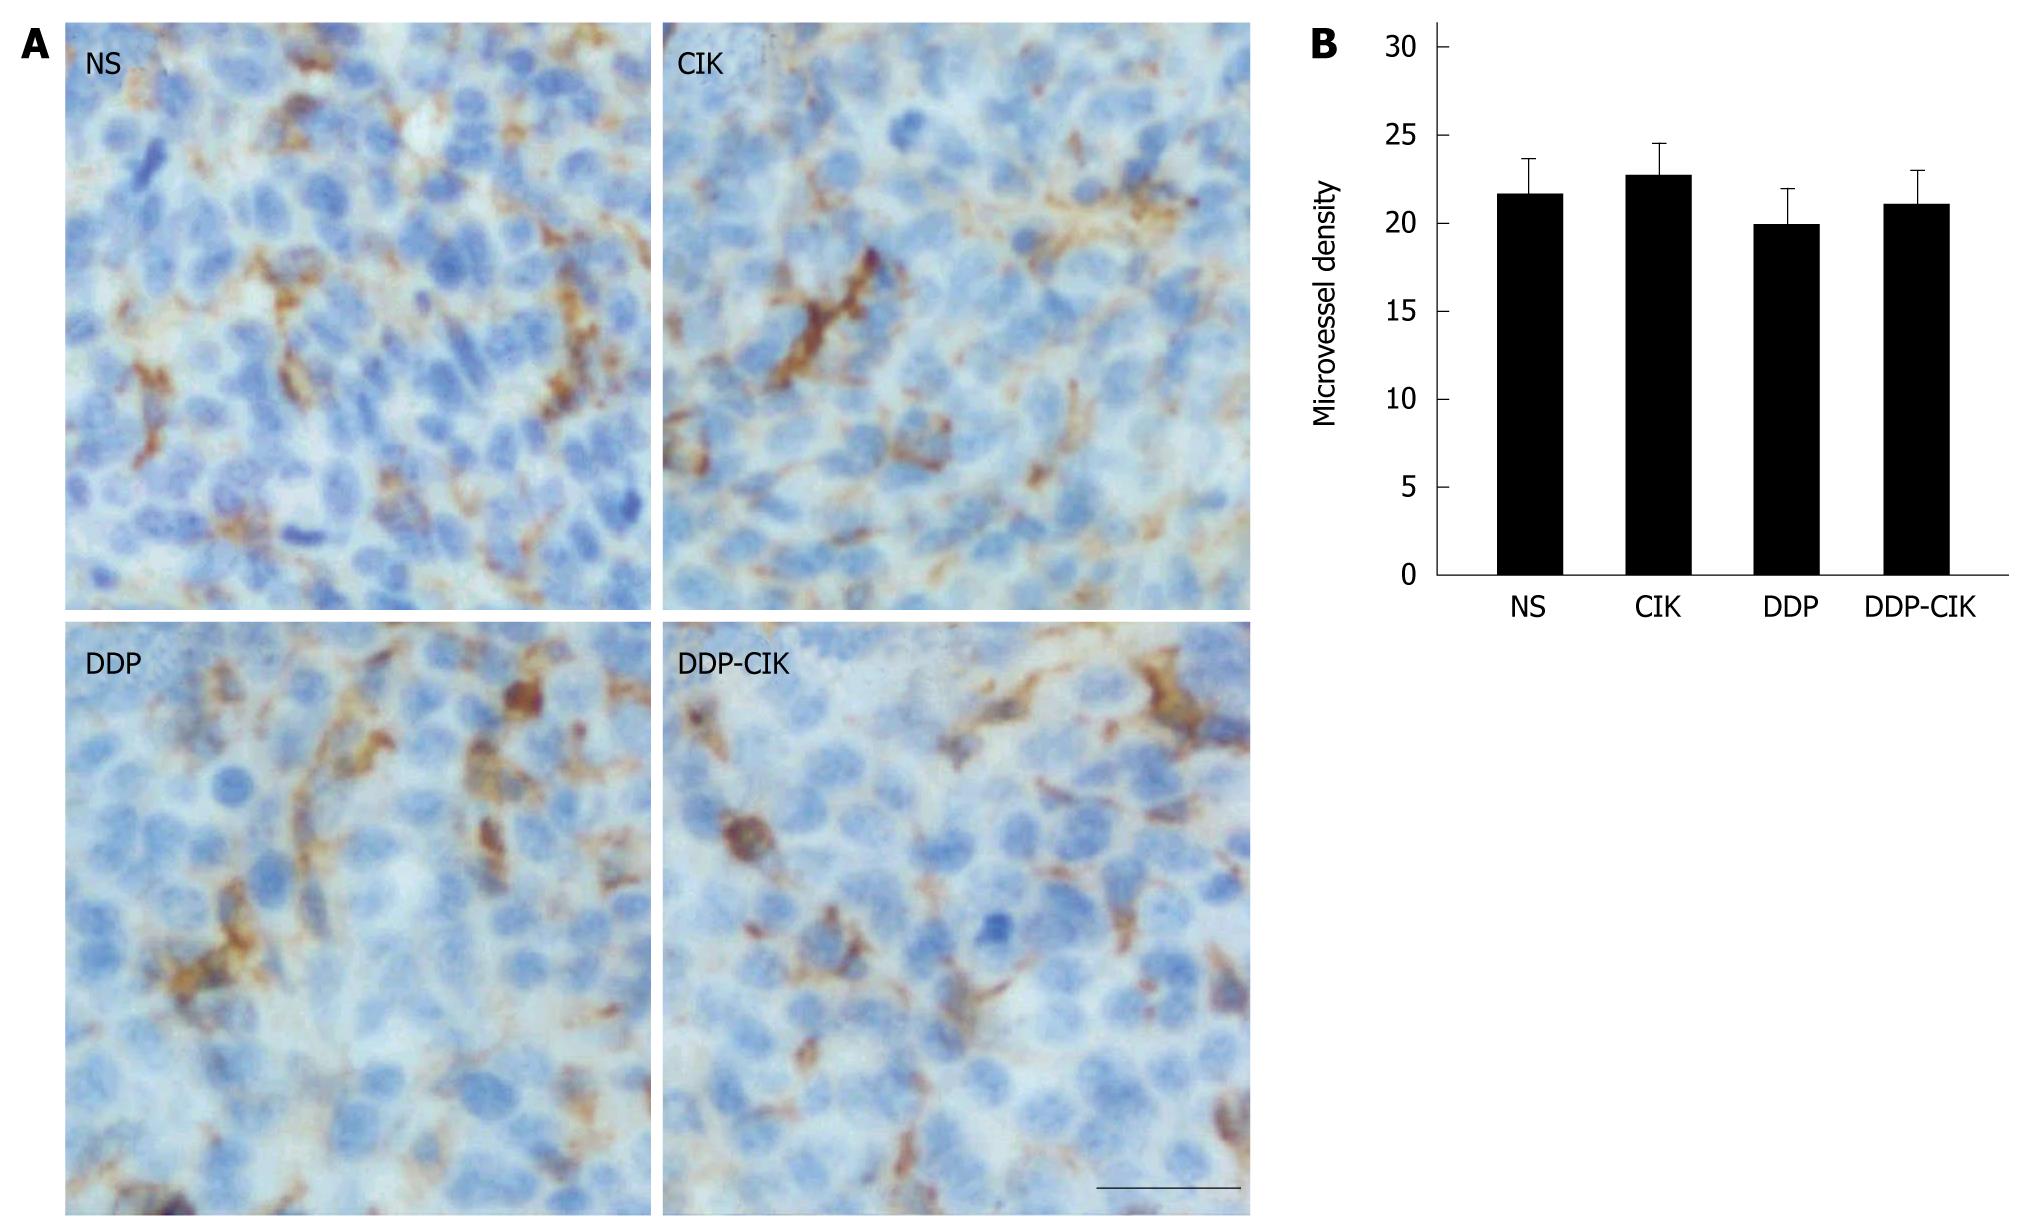
Figure 6 Tumor microvessel density after combination therapy.
BALB/c WT mice were injected s.c. with 1 × 10⁶ CT-26 cells and the treatment protocols were initiated 7 d later. On day 19, tumor sections were prepared and analyzed by CD31 staining (A). Ten individual fields (0.16 mm2) at × 400 magnification were chosen to assess the tumor microvessel density (B). The experimental groups consisted of five mice per group. Representative sections from all groups are shown. Scale bars: 25 μm; Columns: mean microvessel number; Bars: SE.
- Citation: Huang X, Chen YT, Song HZ, Huang GC, Chen LB. Cisplatin pretreatment enhances anti-tumor activity of cytokine-induced killer cells. World J Gastroenterol 2011; 17(25): 3002-3011
- URL: https://www.wjgnet.com/1007-9327/full/v17/i25/3002.htm
- DOI: https://dx.doi.org/10.3748/wjg.v17.i25.3002


