Copyright
©2011 Baishideng Publishing Group Co.
World J Gastroenterol. Jun 28, 2011; 17(24): 2965-2971
Published online Jun 28, 2011. doi: 10.3748/wjg.v17.i24.2965
Published online Jun 28, 2011. doi: 10.3748/wjg.v17.i24.2965
Figure 1 Culture of floating spheres.
Single primary gallbladder carcinoma cells were cultured in serum-free medium containing human epidermal growth factor (20 ng/mL) and basic fibroblast growth factor (10 ng/mL). A: After culture for 1 wk, non-adherent spheres were observable (original magnification × 200); B: The spheres were dissociated and were plated into the same stem-cell-selective medium; similar progeny spheres emerged after 2 wk (original magnification × 200); C: The second progeny spheres were derived from the first progeny sphere-forming cells (original magnification × 200).
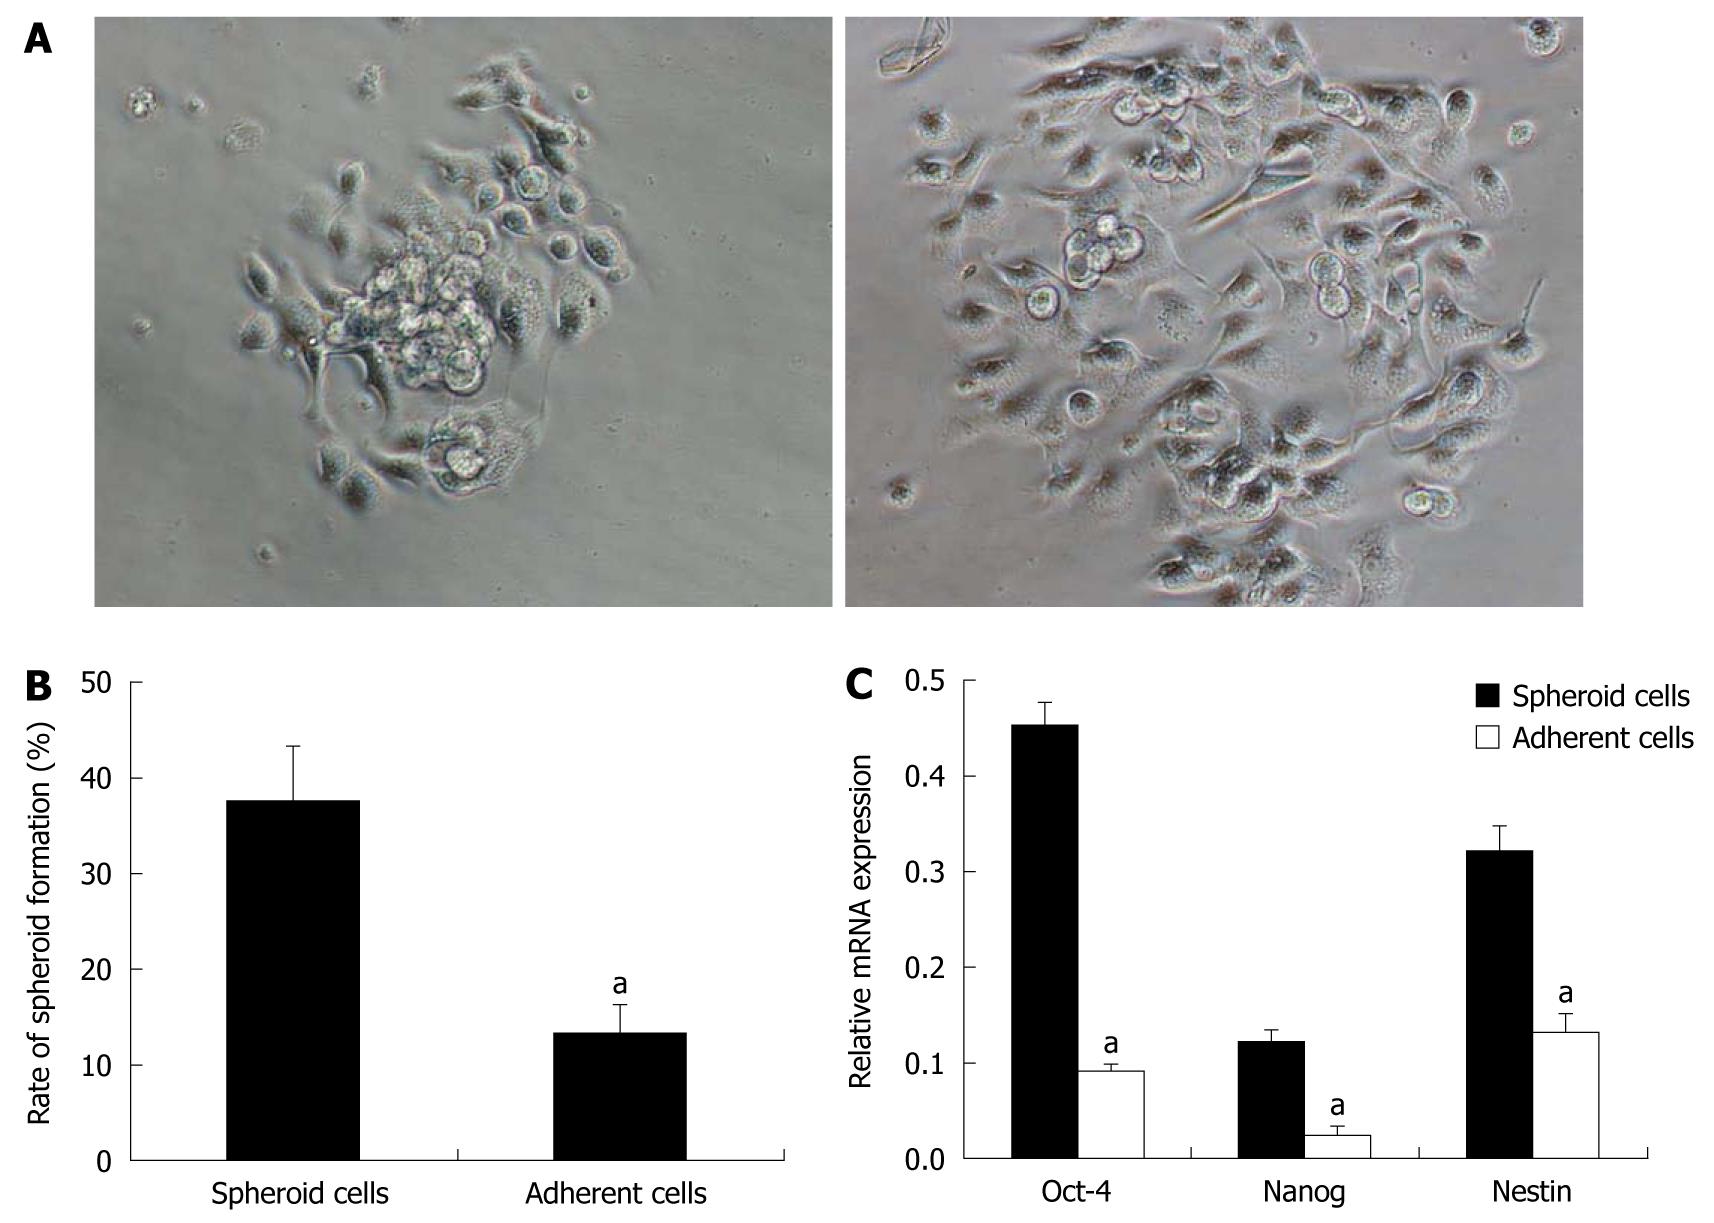
Figure 2 Differentiation of spheroid cells.
Non-adherent spheres were collected and placed into DMEM/F12 supplemented with 10% fetal bovine serum. A: After 6 h, cells migrated from the spheres and became adherent and the sphere volume was significantly reduced (original magnification × 200); B: The spheroid-colony-forming ability of spheroid cells decreased under differentiating conditions. aP < 0.05 vs spheroid cells under stem-cell-selective conditions; C: The expression levels of Oct-4, Nanog and nestin were examined using real-time quantitative reverse transcription-polymerase chain reaction. The stem cell markers were downregulated in the adherent cells. aP < 0.05 vs spheroid cells under stem-cell-selective conditions.
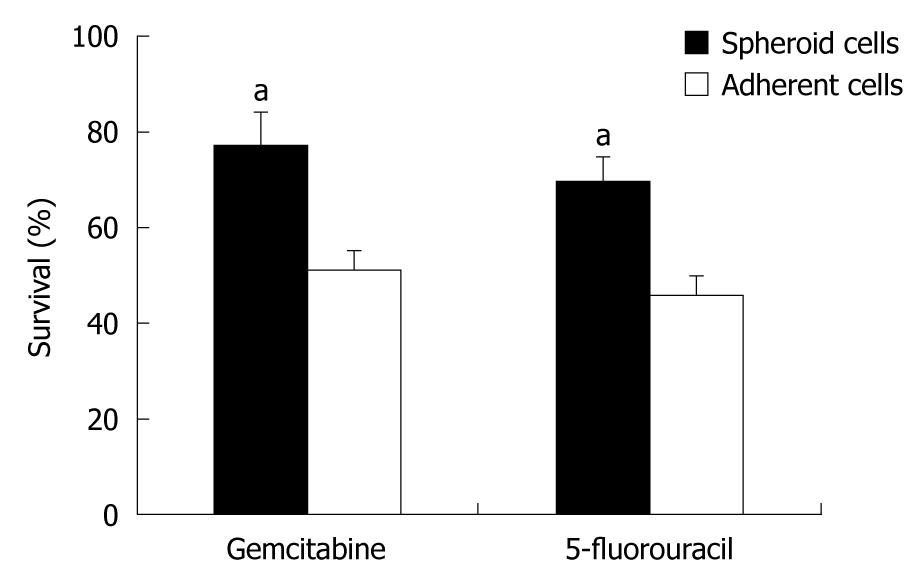
Figure 3 Chemoresistance assays of spheroid cells.
Sphere-forming cells and differentiated cells were seeded in 96-well plates at 3000 cells/well. Chemotherapeutic reagents gemcitabine (1 μg/mL) and 5-fluorouracil (0.1 μg/mL) were added and cell survival was estimated by 3-(4,5-dimethylthiazol-2)-2,5-diphenyltetrazolium bromide assay. aP < 0.05 vs differentiated cells.
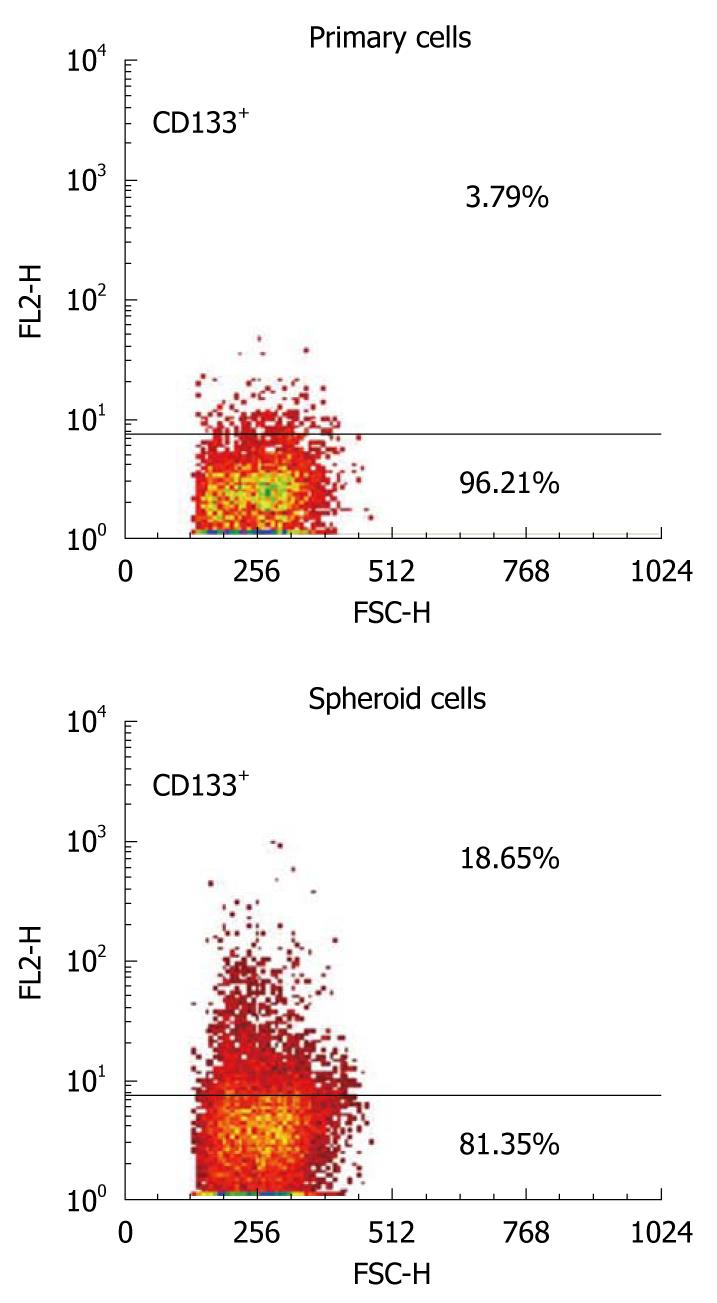
Figure 4 CD133 expression in gallbladder carcinoma spheroid cells.
The single cells dissociated from primary tumors or spheres were incubated with anti-CD133/1-phycoerythrin and flow cytometric analysis was performed. The percentage of CD133+ cells was higher in the spheroid cells. P < 0.05 vs primary gallbladder carcinoma cells.
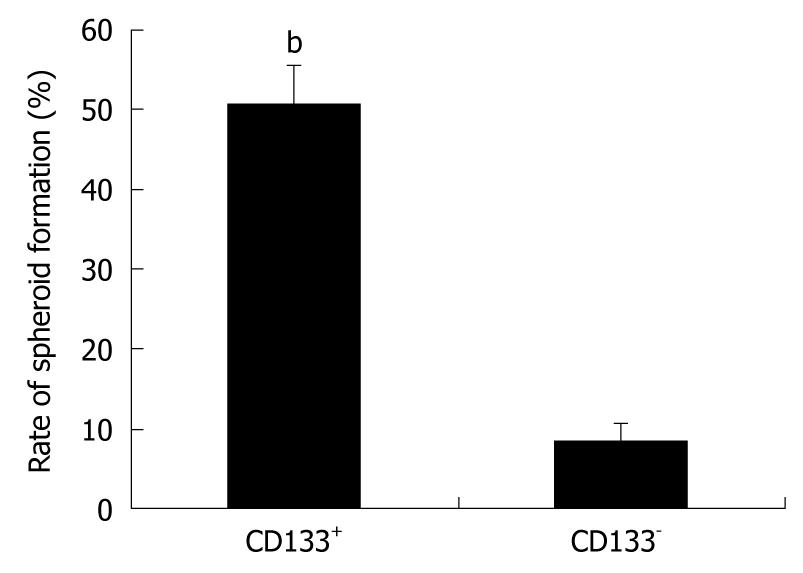
Figure 5 Spheroid-colony-formation assay of CD133+ cells.
Sphere-forming cells were isolated by fluorescence-activated cell sorting for marker CD133 and cultured in 96-well plates in serum-free medium (10 cells per well) containing human epidermal growth factor (20 ng/mL) and basic fibroblast growth factor (10 ng/mL). After 2 wk, the total number of spheroid colonies containing more than 20 cells was counted. CD133+ cells generated more spheroid colonies. bP < 0.01.
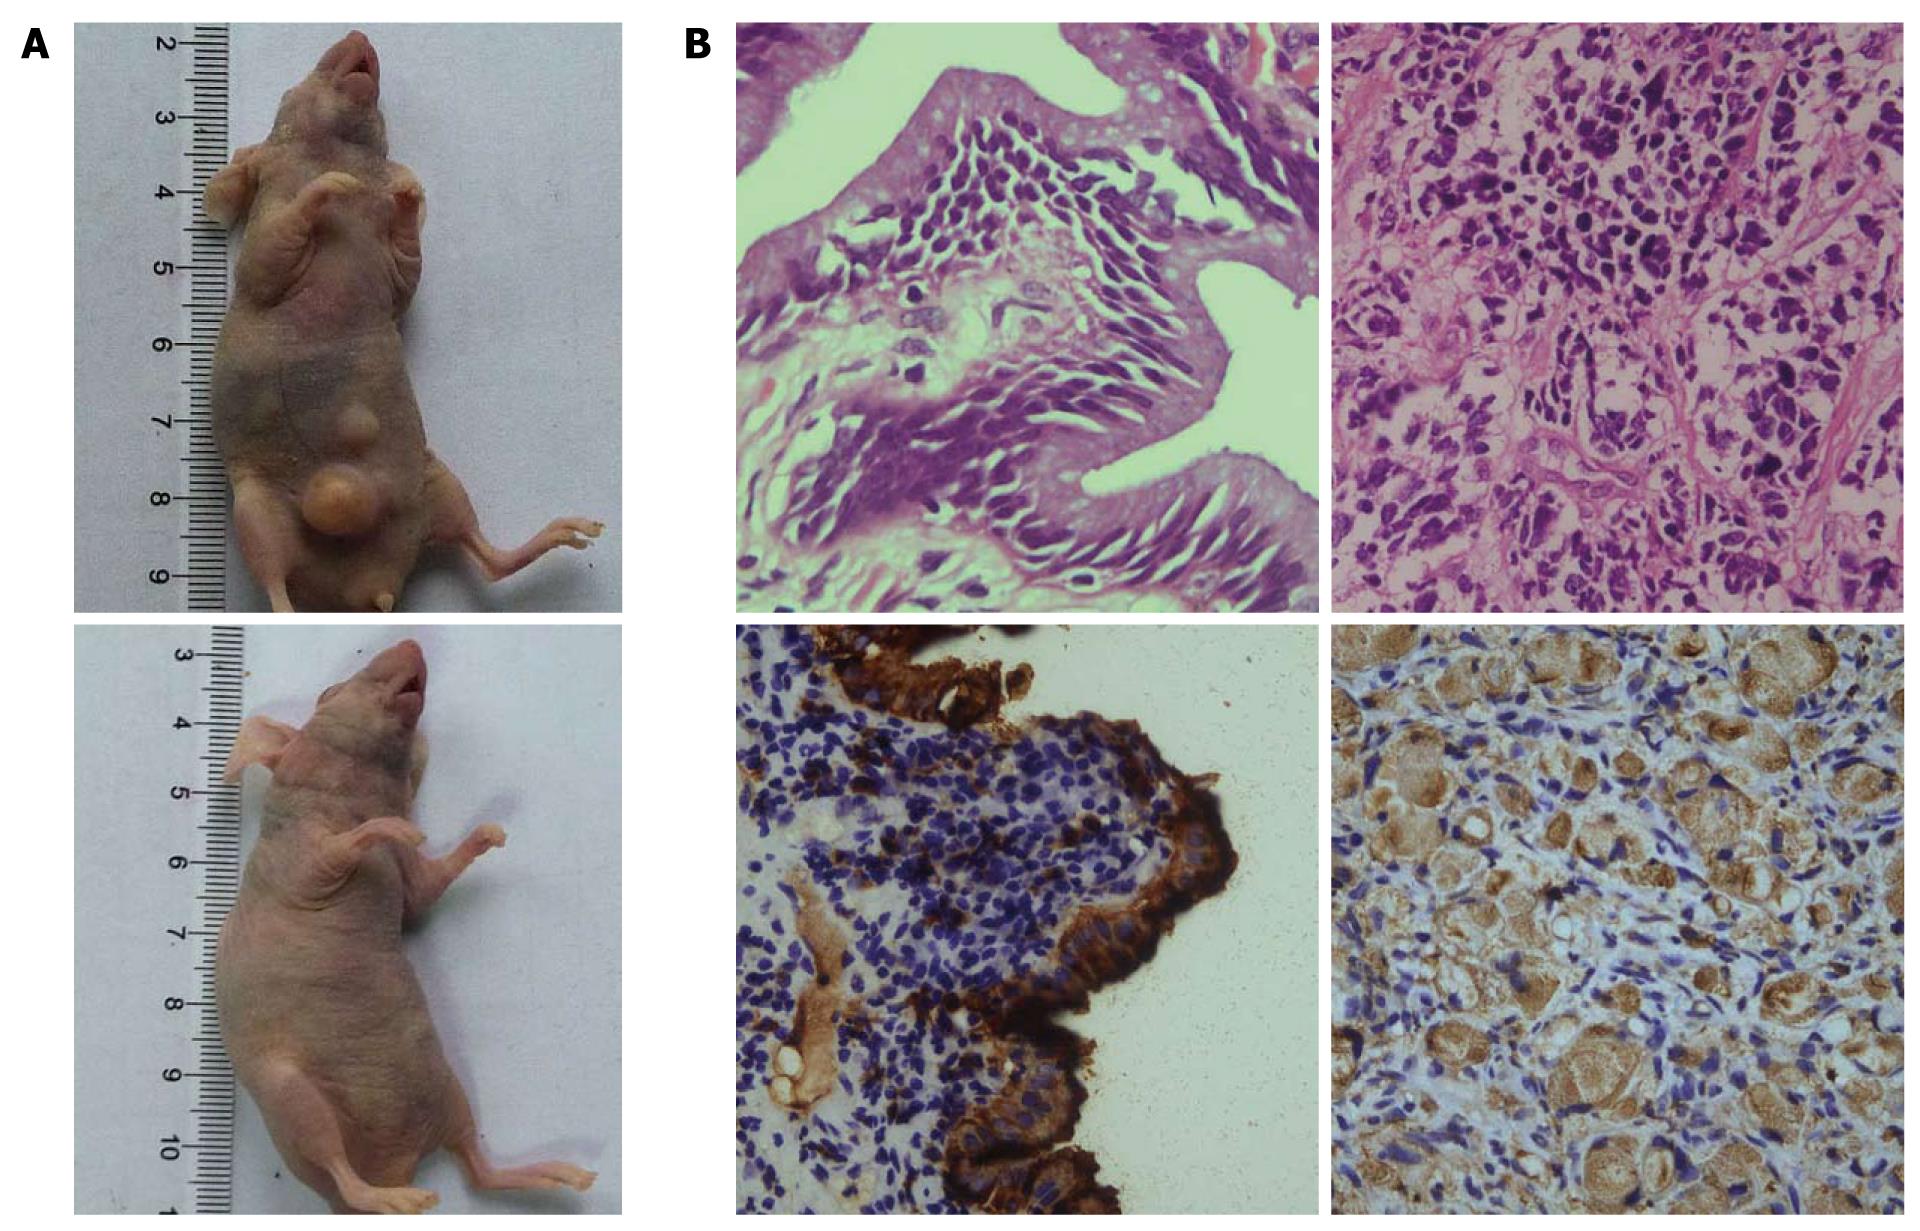
Figure 6 Xenograft formation of CD133+ gallbladder carcinoma cells.
Sorted cells were injected subcutaneously into the abdominal regions of nude mice at a dose of 10 000 cells. A: CD133+ cells produced palpable xenograft tumors at the injection site, whereas CD133- cells generated no tumors; B: Hematoxylin and eosin staining of xenograft and expression of CA19-9 (original magnification × 200).
- Citation: Shi CJ, Gao J, Wang M, Wang X, Tian R, Zhu F, Shen M, Qin RY. CD133+ gallbladder carcinoma cells exhibit self-renewal ability and tumorigenicity. World J Gastroenterol 2011; 17(24): 2965-2971
- URL: https://www.wjgnet.com/1007-9327/full/v17/i24/2965.htm
- DOI: https://dx.doi.org/10.3748/wjg.v17.i24.2965


