Copyright
©2011 Baishideng Publishing Group Co.
World J Gastroenterol. Jun 28, 2011; 17(24): 2933-2940
Published online Jun 28, 2011. doi: 10.3748/wjg.v17.i24.2933
Published online Jun 28, 2011. doi: 10.3748/wjg.v17.i24.2933
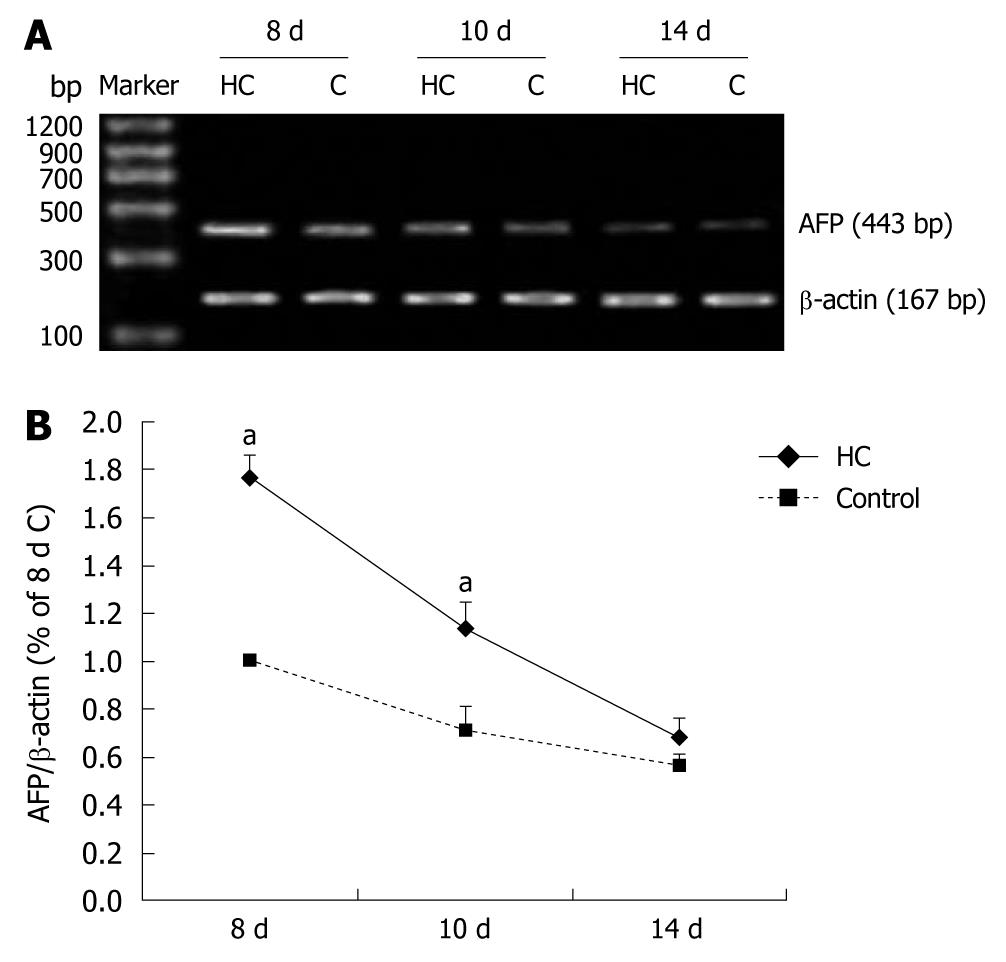
Figure 1 Expression of α-fetoprotein mRNA by reverse transcriptase polymerase chain reaction analysis in colons of suckling rats treated with or without hydrocortisone.
Molecular weight markers are indicated on the left. A: The α-fetoprotein (AFP) mRNA levels in colons of hydrocortisone-treated animals were higher than in controls of 8- and 10-d-old rats; B: Results are indicated in percentage above the β-actin value and are representative of three independent experiments. aP < 0.05 vs controls; C: Pups received saline; HC: Pups received hydrocortisone.
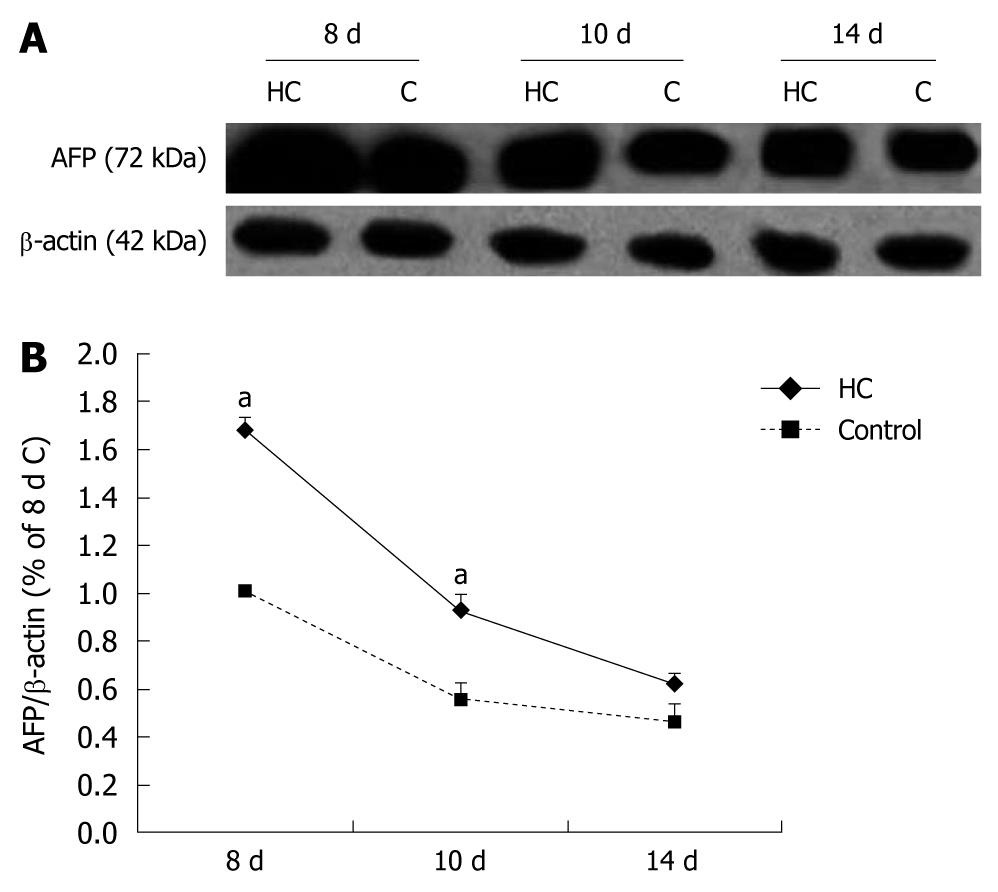
Figure 2 Expression of α-fetoprotein protein by Western blotting analysis in colons of suckling rats treated with or without hydrocortisone as indicated in lanes, respectively.
Western blotting analysis using α-fetoprotein (AFP) (C-19), revealed a 72 kDa isoform. A: AFP levels in colons of hydrocortisone-treated animals were higher than in controls of 8- and 10-d-old rats; B: Results are indicated in percentage above the β-actin value and are representative of three independent experiments. aP < 0.05 vs controls; C: Pups received saline; HC: Pups received hydrocortisone.
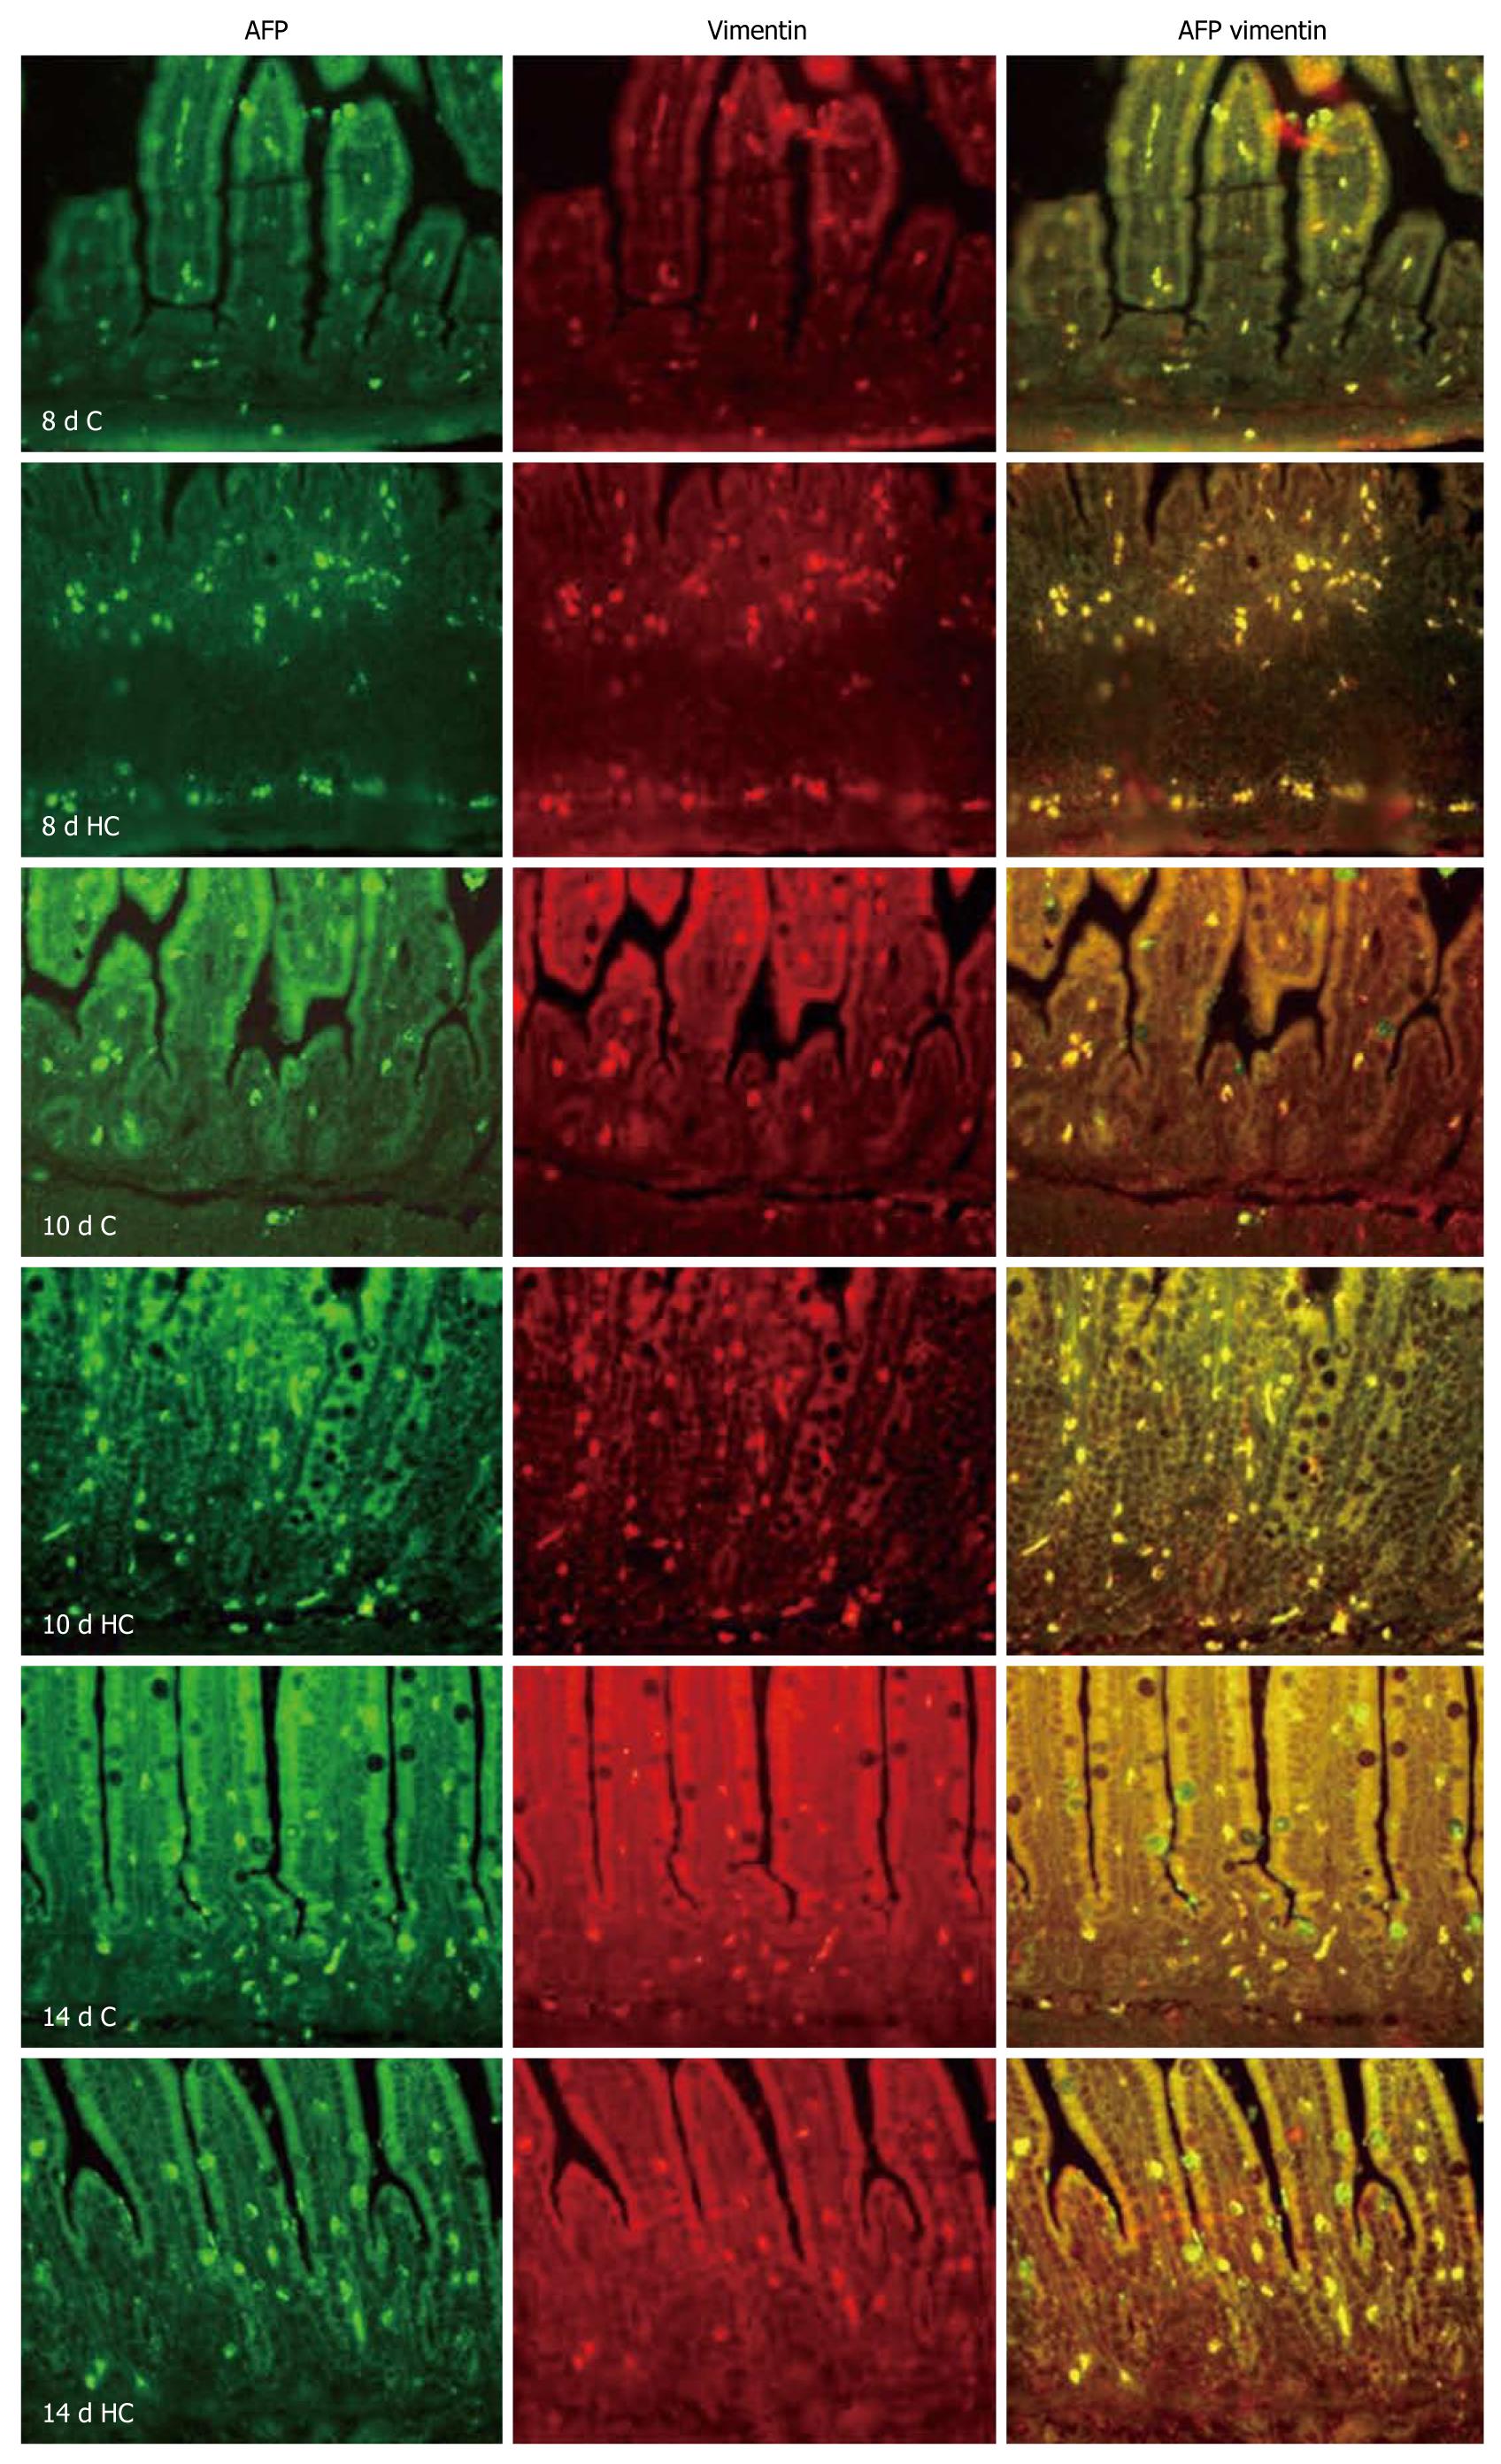
Figure 3 Immunofluorescence localization of α-fetoprotein and vimentin in the suckling rats treated with or without hydrocortisone.
Labeling by the α-fetoprotein (AFP) antibody was detected with a fluorescein isothiocyanate (green) labeled secondary antibody. Labeling of vimentin was detected with a rhodamine-(red)-labeled secondary antibody on the same section. The overlap of AFP (green) and vimentin (red) labeling displayed orange color. Double-staining revealed complete colocalization of AFP and vimentin in the same cells of rat colons treated with or without hydrocortisone. All of the primary magnifications are × 200.
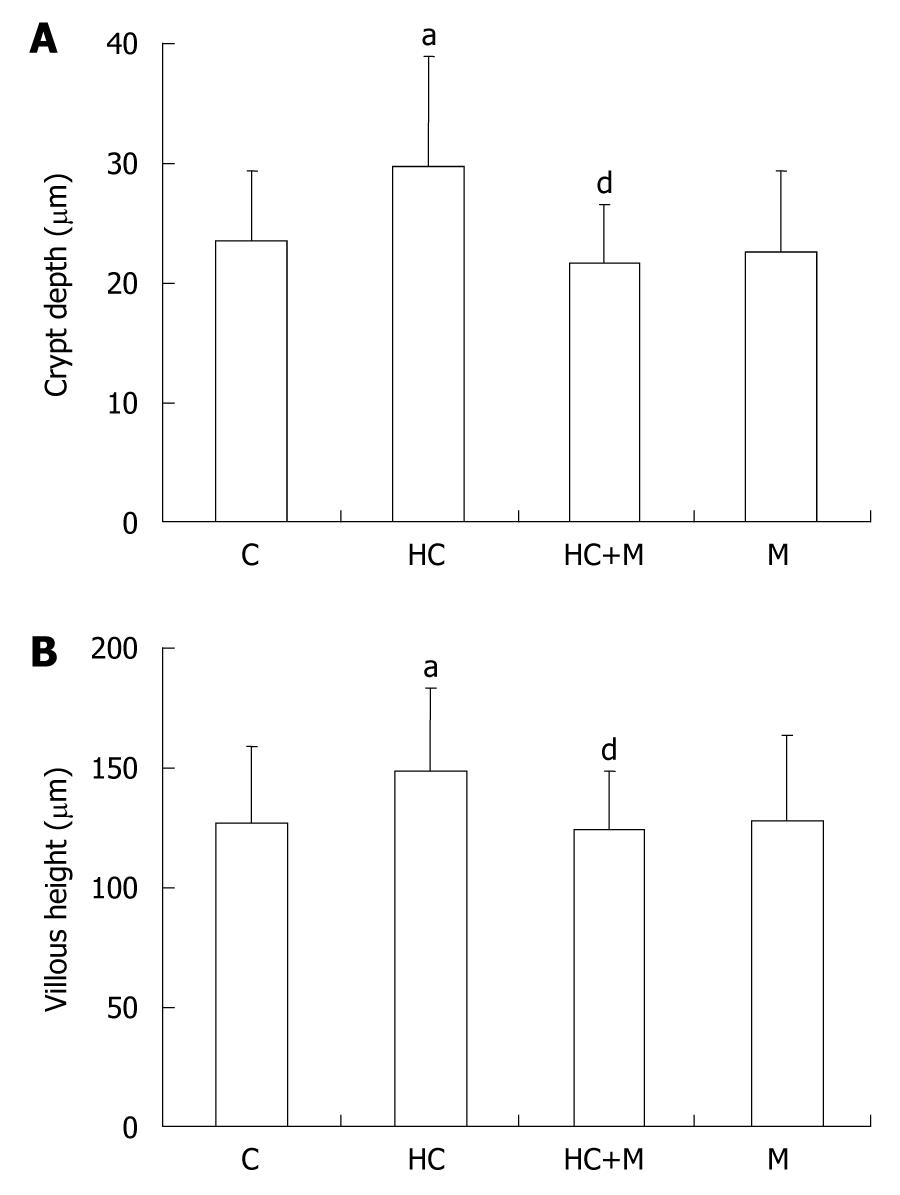
Figure 4 Morphological changes in colons of suckling rats treated with or without hydrocortisone, hydrocortisone + mifepristone and mifepristone alone.
Villous height (A) and crypt depth (B) were determined. Each data point (± SD; bars) is the mean of four independent trials. C: Pups received saline; HC: Pups received hydrocortisone; HC+M: Pups treated with both hydrocortisone and mifepristone; M: Pups treated with mifepristone only. aP < 0.05 vs control animals;dP < 0.01 vs hydrocortisone-treated animals.
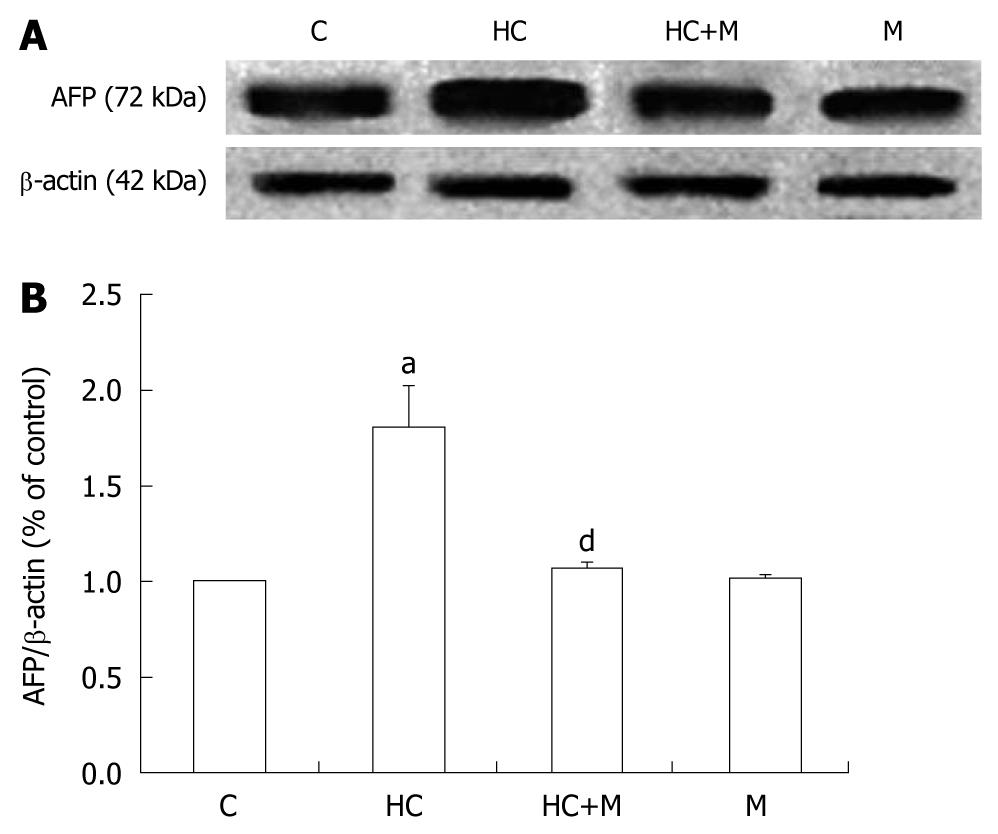
Figure 5 α-fetoprotein expressions in 8-d-old rat colons treated with or without hydrocortisone, hydrocortisone + mifepristone and mifepristone alone.
α-fetoprotein (AFP) expression was determined by the Western blotting using AFP polyclonal antibody (A), and results indicated are in percentage above the β-actin value and are representative of three independent experiments (B). Each data point (± SD; bars) is the mean of four independent trials. C: Pups received saline; HC: Pups received hydrocortisone; HC+M: Pups treated with both hydrocortisone and mifepristone; M: Pups treated with mifepristone only. aP < 0.05 vs control animals; dP < 0.01 vs hydrocortisone-treated animals.
- Citation: Chen M, Sun P, Liu XY, Dong D, Du J, Gu L, Ge YB. α-fetoprotein involvement during glucocorticoid-induced precocious maturation in rat colon. World J Gastroenterol 2011; 17(24): 2933-2940
- URL: https://www.wjgnet.com/1007-9327/full/v17/i24/2933.htm
- DOI: https://dx.doi.org/10.3748/wjg.v17.i24.2933


