Copyright
©2011 Baishideng Publishing Group Co.
World J Gastroenterol. Jun 28, 2011; 17(24): 2909-2923
Published online Jun 28, 2011. doi: 10.3748/wjg.v17.i24.2909
Published online Jun 28, 2011. doi: 10.3748/wjg.v17.i24.2909
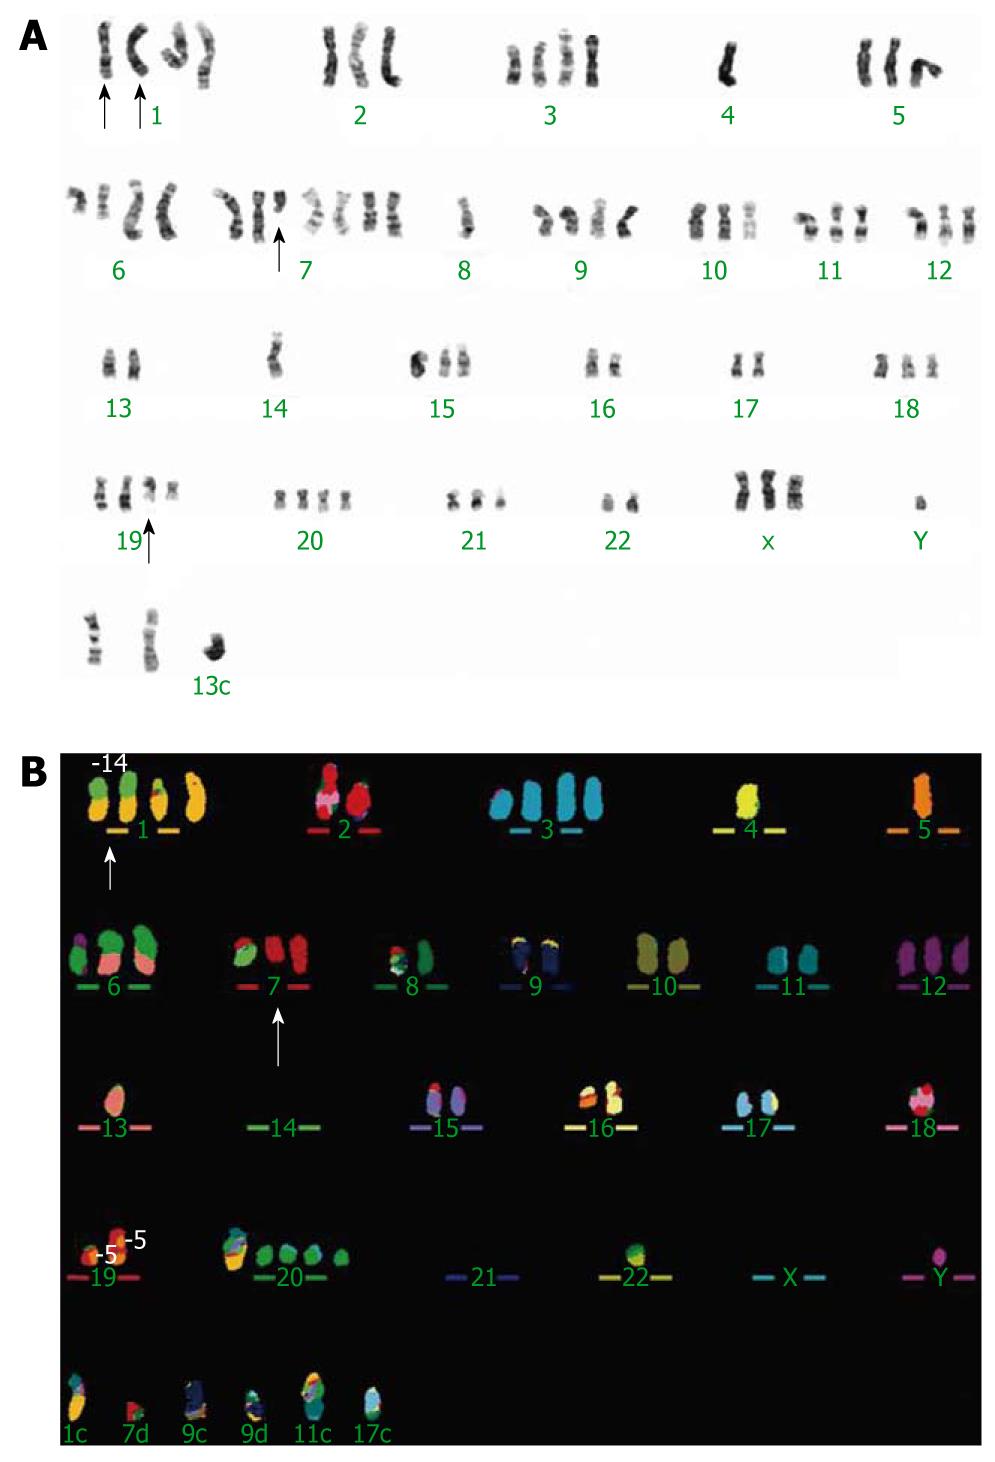
Figure 1 G-banded and multicolor fluorescence in situ hybridization representative karyotypes of cell line WHCO1.
A: G-banded karyotype; B: Multicolor fluorescence in situ hybridization (M-FISH) karyotype, the arrows indicate the marker chromosomes, der(1) t(1;14)(p11;q11) and del(7)(q21).
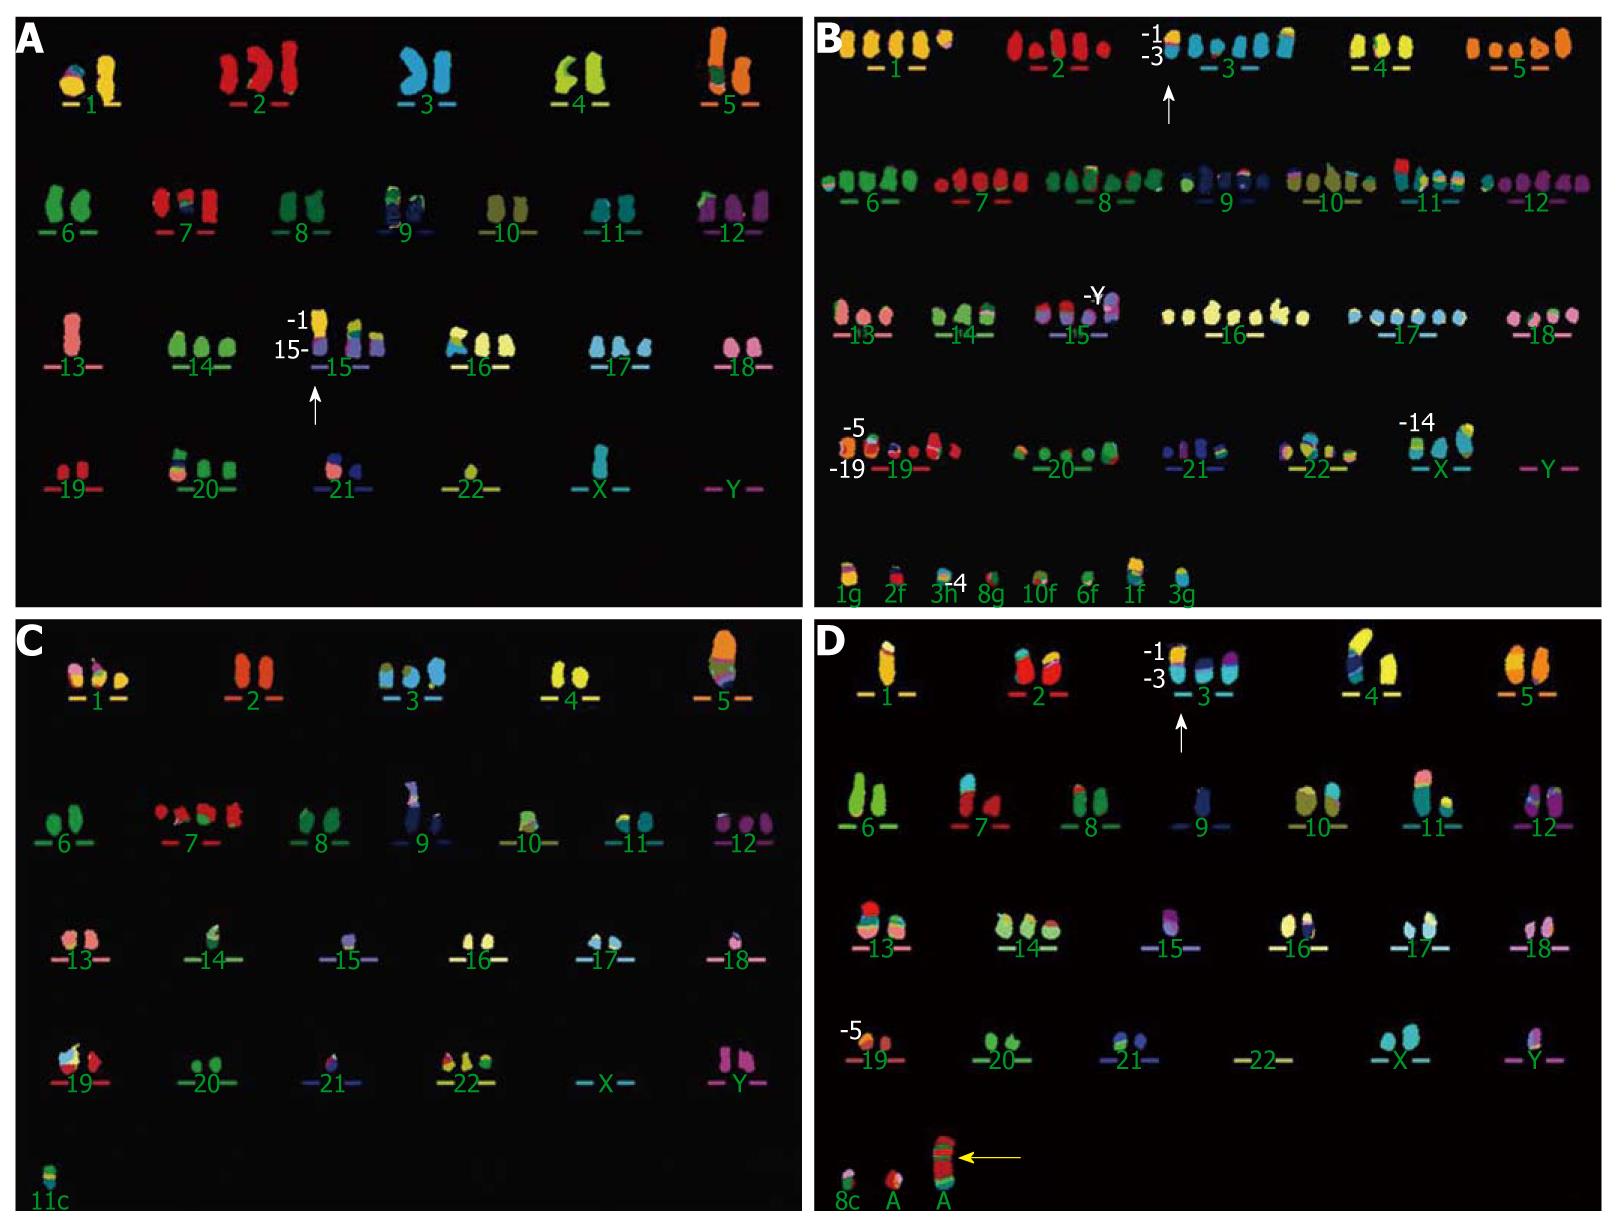
Figure 2 Multicolor fluorescence in situ hybridization representative karyotypes showing complex rearrangements in four cell lines.
A: Cell line WHCO3, the white arrow indicates the der(15)t(1;15)(q11;p11); B: Cell line WHCO5, the white arrow points to the der(3)t(1;3)(p11-12;q11); C: Cell line WHCO6; D: Cell line SNO, the white arrow points to the der(3)t(1;3)(p11-12;p11) and the yellow arrow indicates the marker chromosome 7, mar(7), which involves the EGFR (epidermal growth factor receptor) locus (Figure 6).
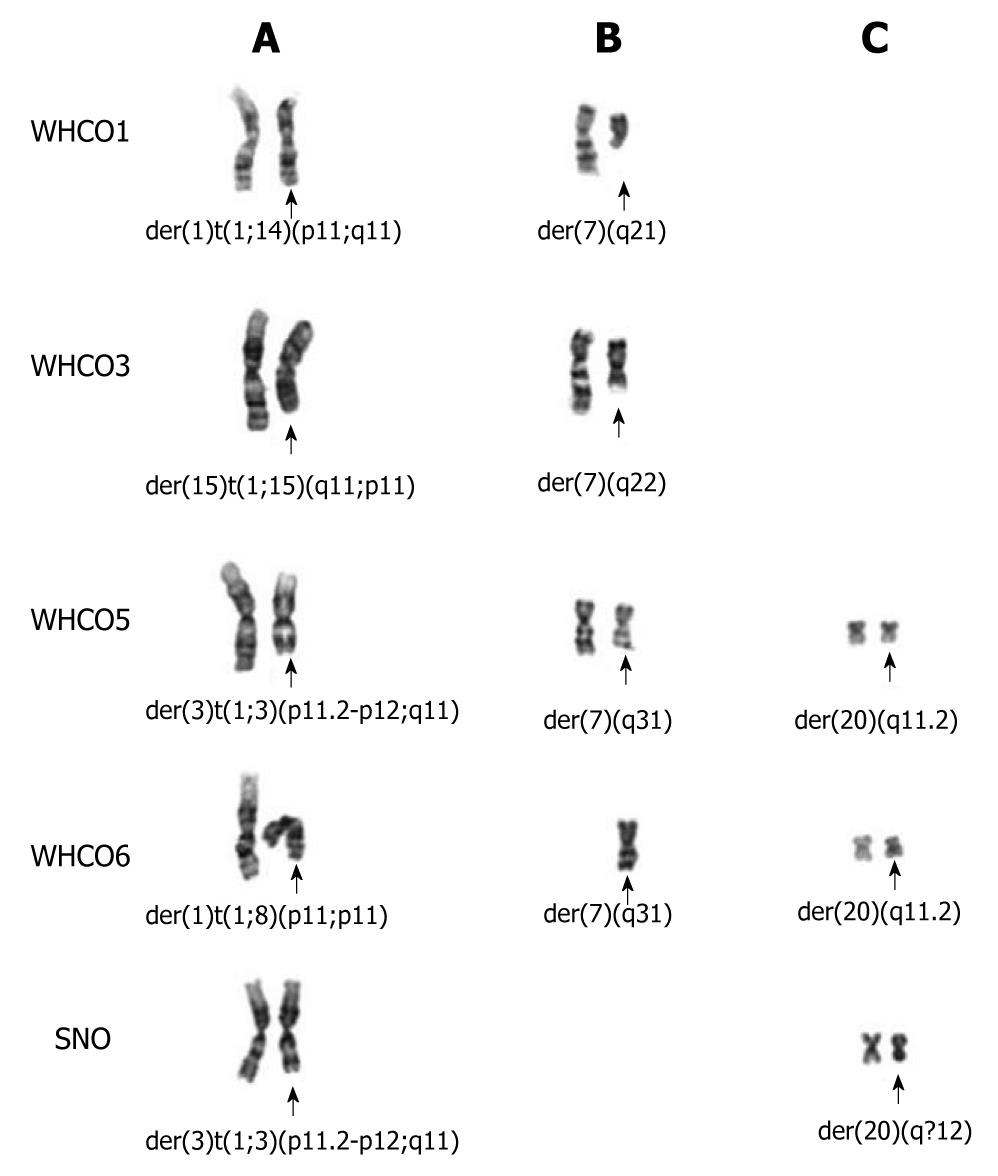
Figure 3 Partial G-banded karyotypes of the five cell lines showing shared chromosomal aberrations across cell lines.
Chromosome derivatives from unbalanced translocations involving (A) chromosome 1p11-12 breakpoints in four cell lines, 1q11 in cell line WHCO3, (B) deletions of chromosome 7q in four cell lines, and (C) deletions of chromosome 20q in three cell lines.
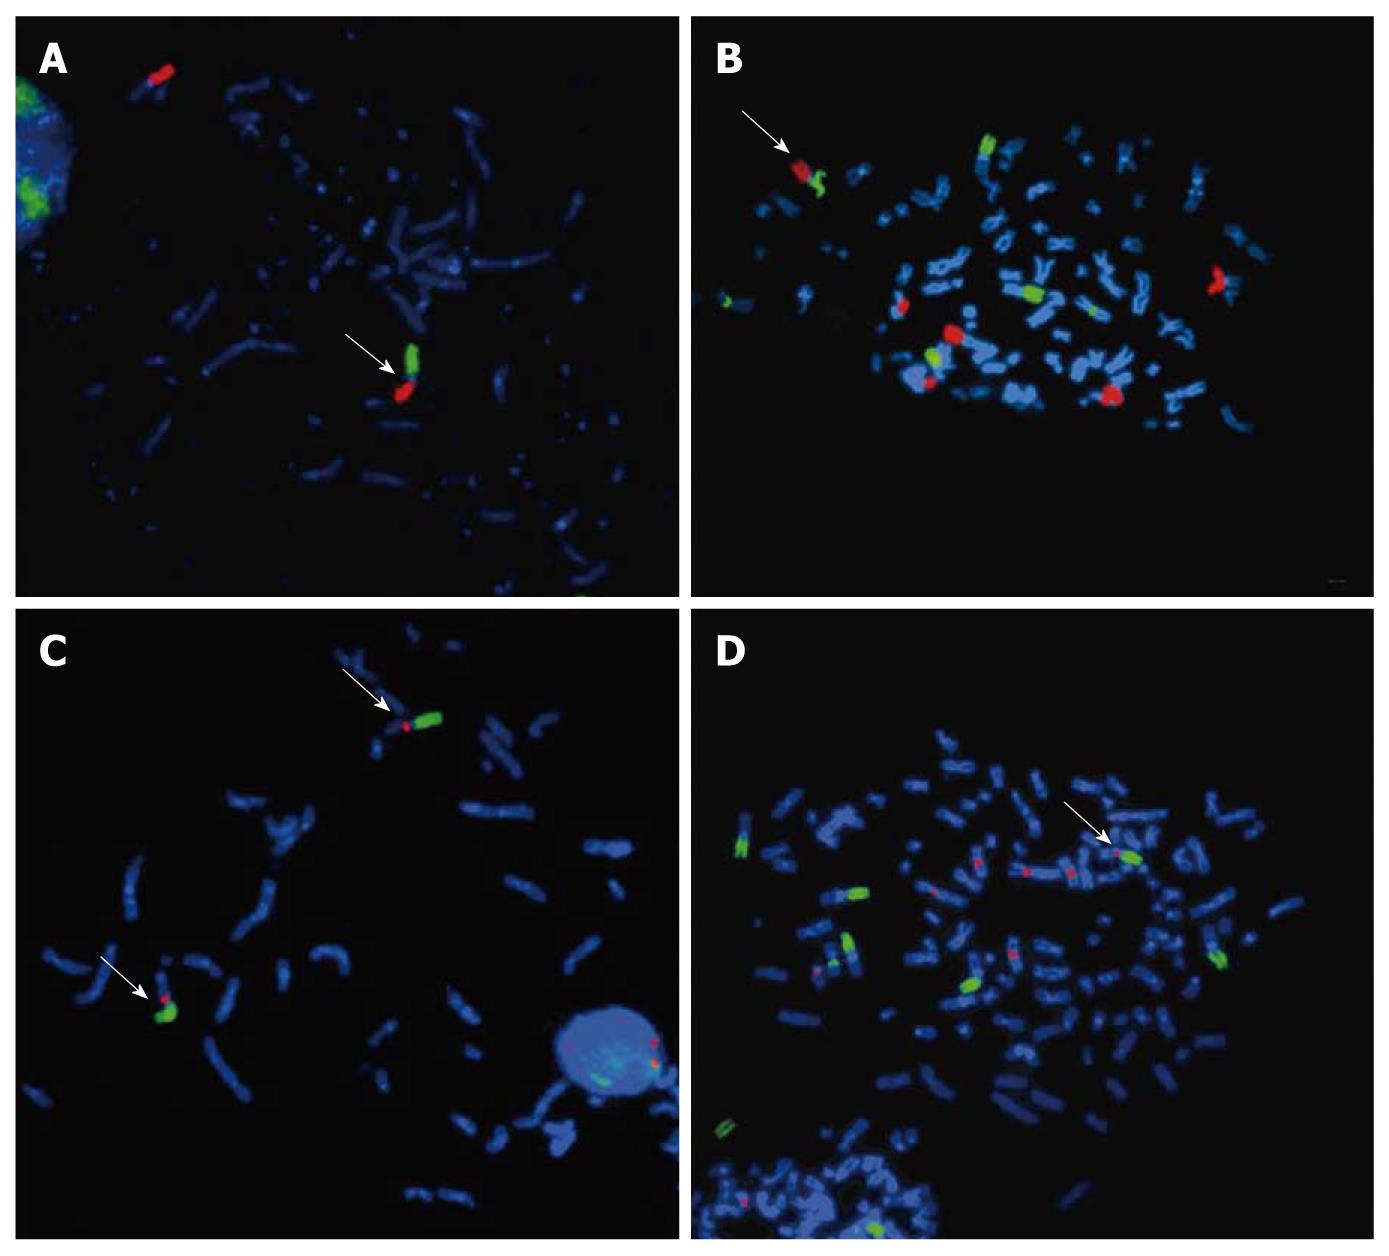
Figure 4 DAPI stained metaphasic chromosomes showing the der(3)t(1;3)(p11-12;q11) in cell lines SNO and WHCO5.
A, B: Arm-specific paint for chromosomes 1p (green) and 3p (red) in cell lines SNO and WHCO5 respectively showing the derivatives der(3)t(1;3)(p11-12;q11) arrowed; C, D: Arm specific paint for chromosome 1p (green) and Cep 3 α probe (red) in cell lines SNO and WHCO5 respectively showing that the centromere of chromosome 3 is retained on the derivatives der(3)t(1;3)(p11-12;q11).
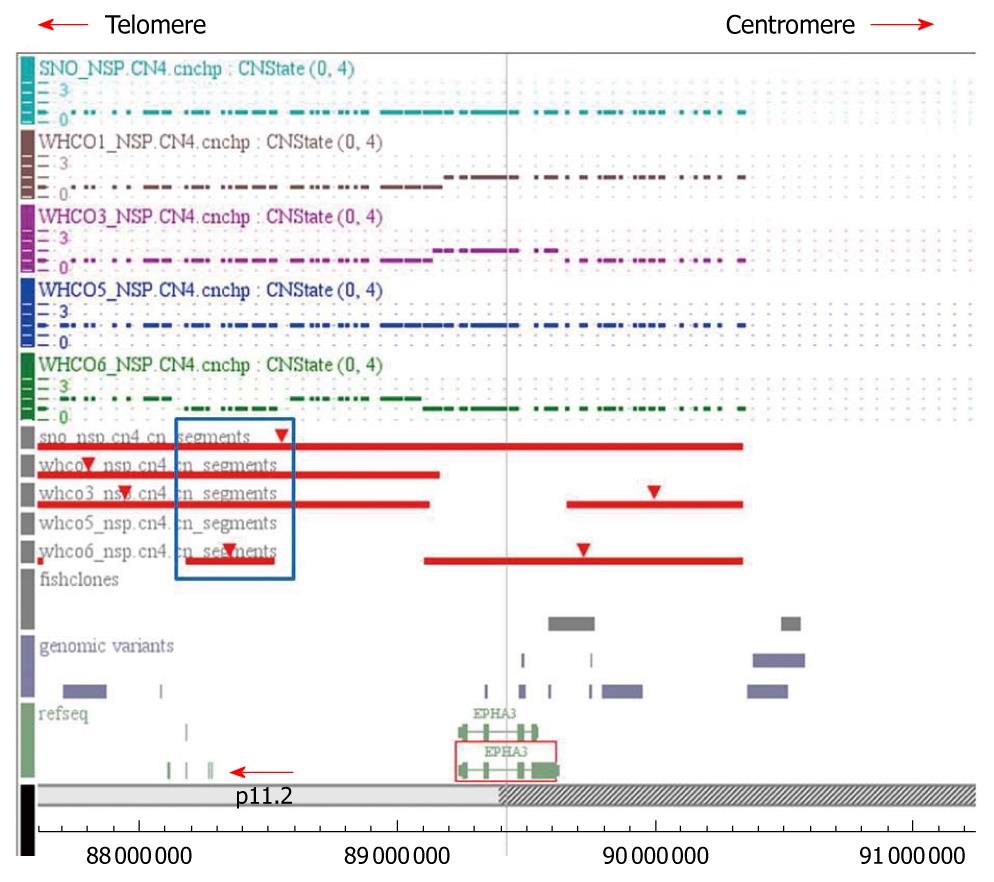
Figure 5 CNAT plot of single nucleotide polymorphism hybridization results showing the map of the region of deletion on chromosome 3p11.
2-12.1 in cell lines WHCO1, WHCO3, WHCO5, WHCO6 and SNO. The red bars indicate the segment of deletion as determined by CNAT 4.0. The dotted lines indicate the copy number status for each single nucleotide polymorphism probe for each cell line. The blue block indicates the minimal common region of deletion and the red arrow indicates the two genes in this region, c3orf38 and CGGBP1.
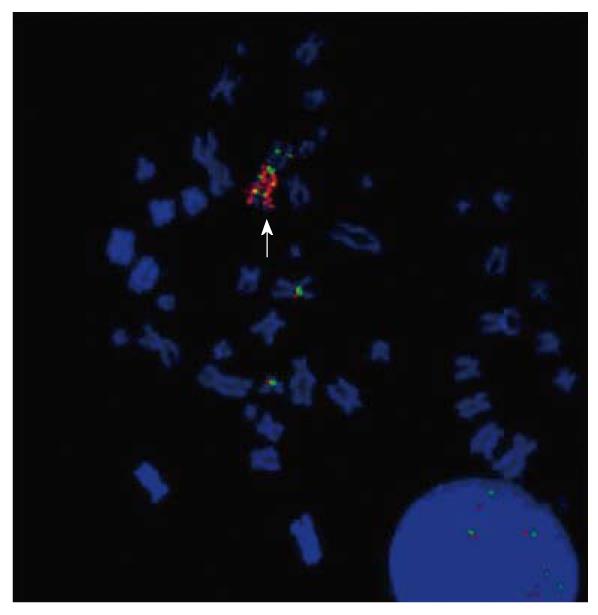
Figure 6 DAPI stained metaphase from cell line SNO showing fluorescence in situ hybridization results with the locus specific EGFR probe (red) and Cep7 α (green).
The arrow indicates the chromosome 7 marker with a homogeneously stained region that contains the EGFR locus.
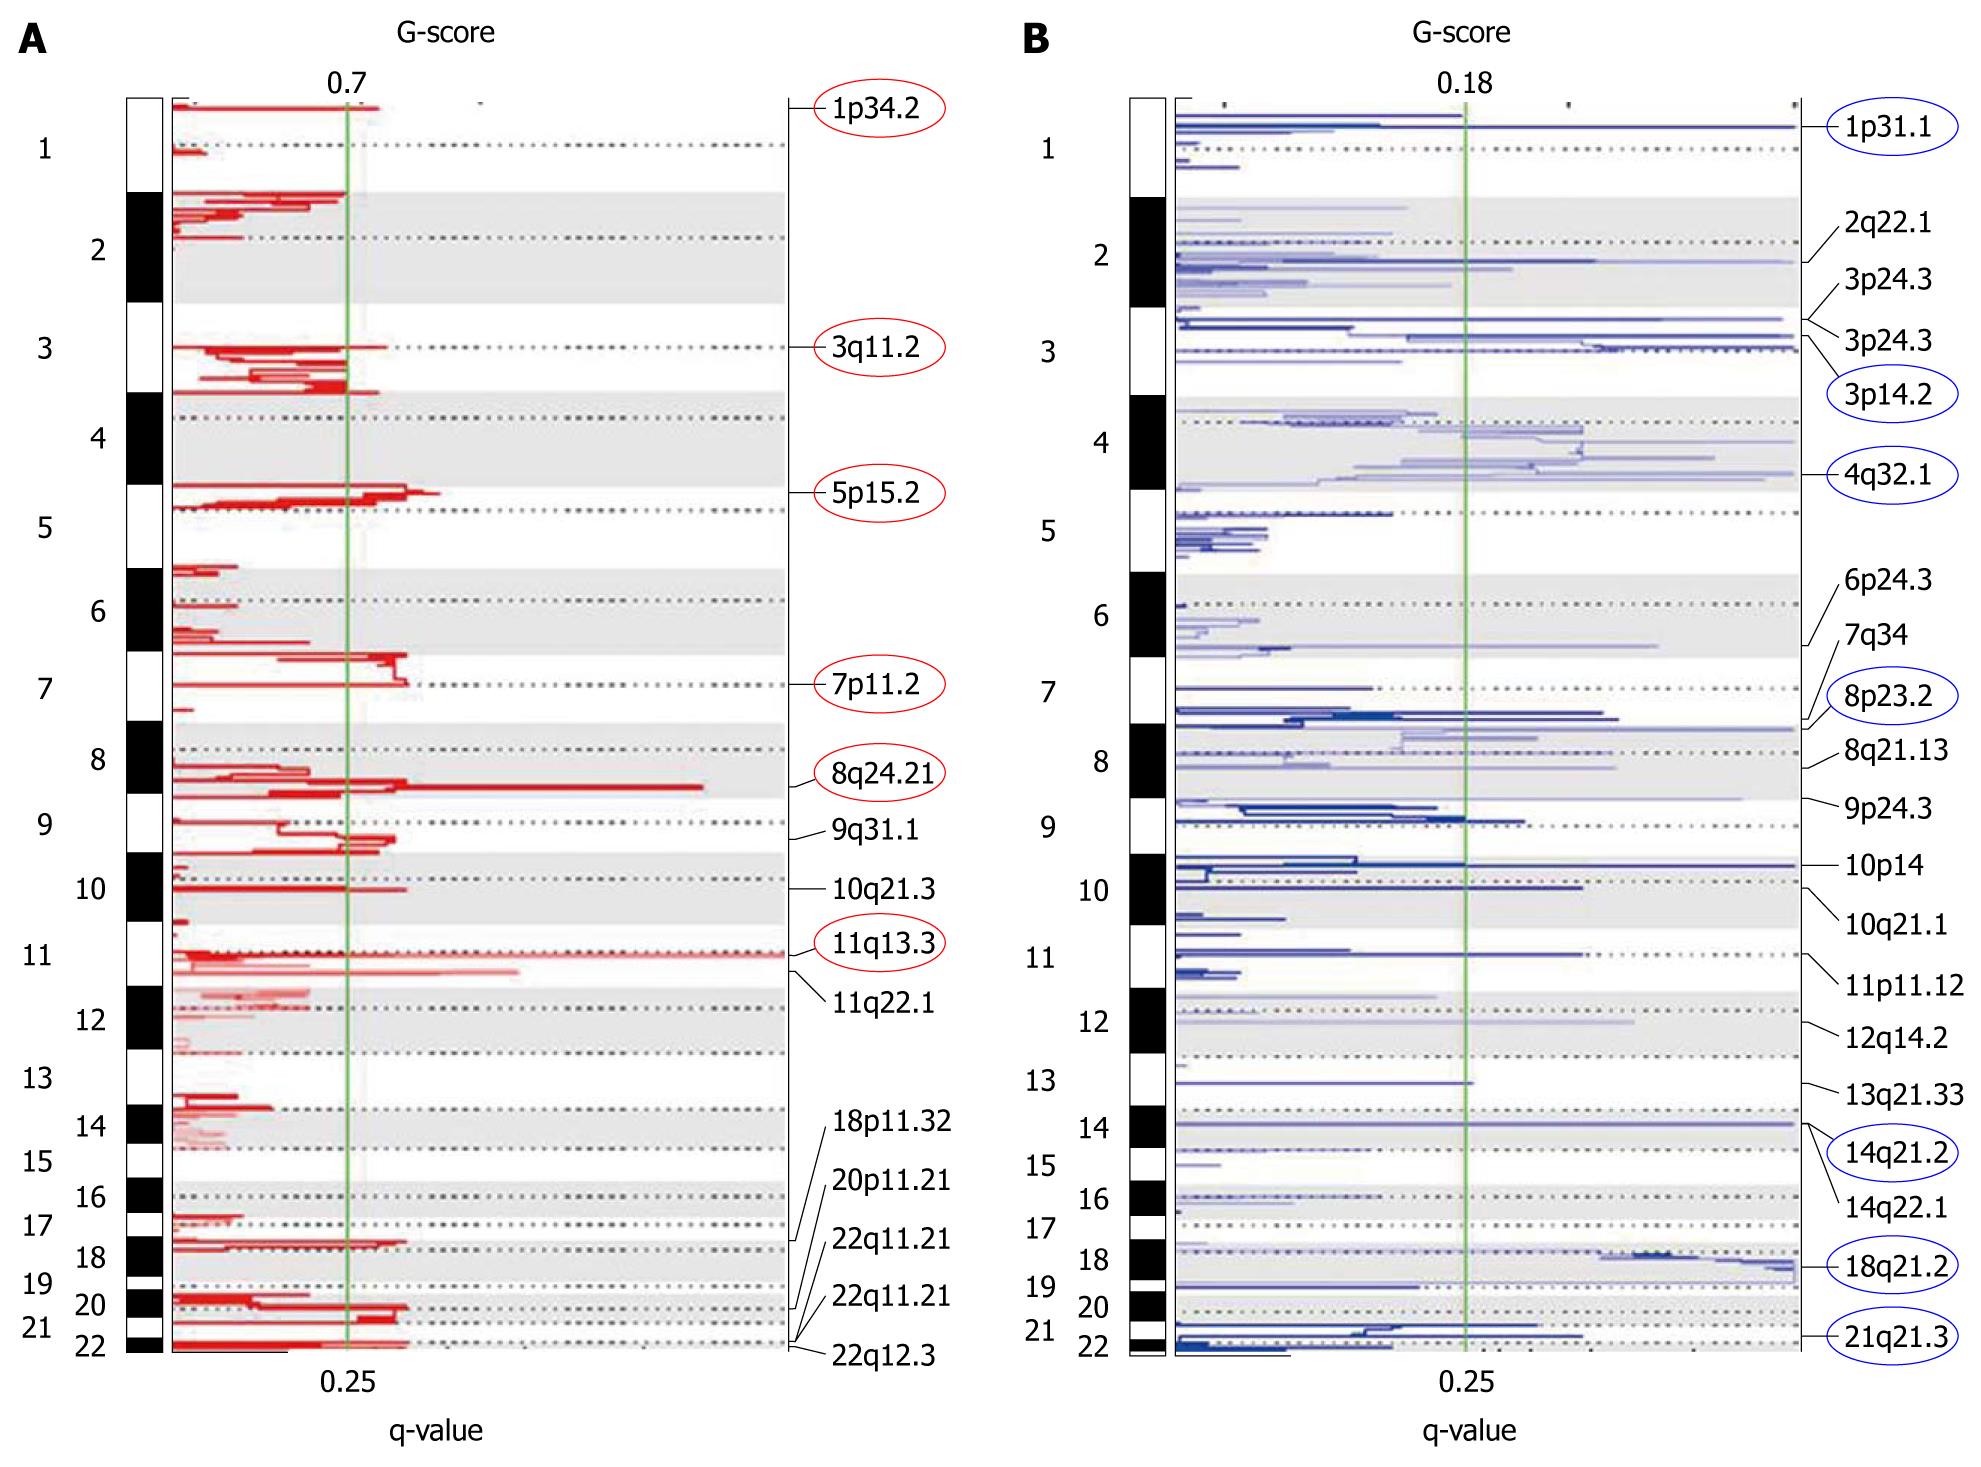
Figure 7 Plots of recurrent genomic amplifications (A) and deletions (B) detected in the esophageal squamous cell carcinoma cell lines from GISTIC analysis of single nucleotide polymorphism array data.
The x-axis shows the G-score (top) and false discovery rate (q value; bottom). The green line indicates the false discovery rate cut off of 0.25. The circles indicate the peaks of the most significantly aberrant chromosomal regions.
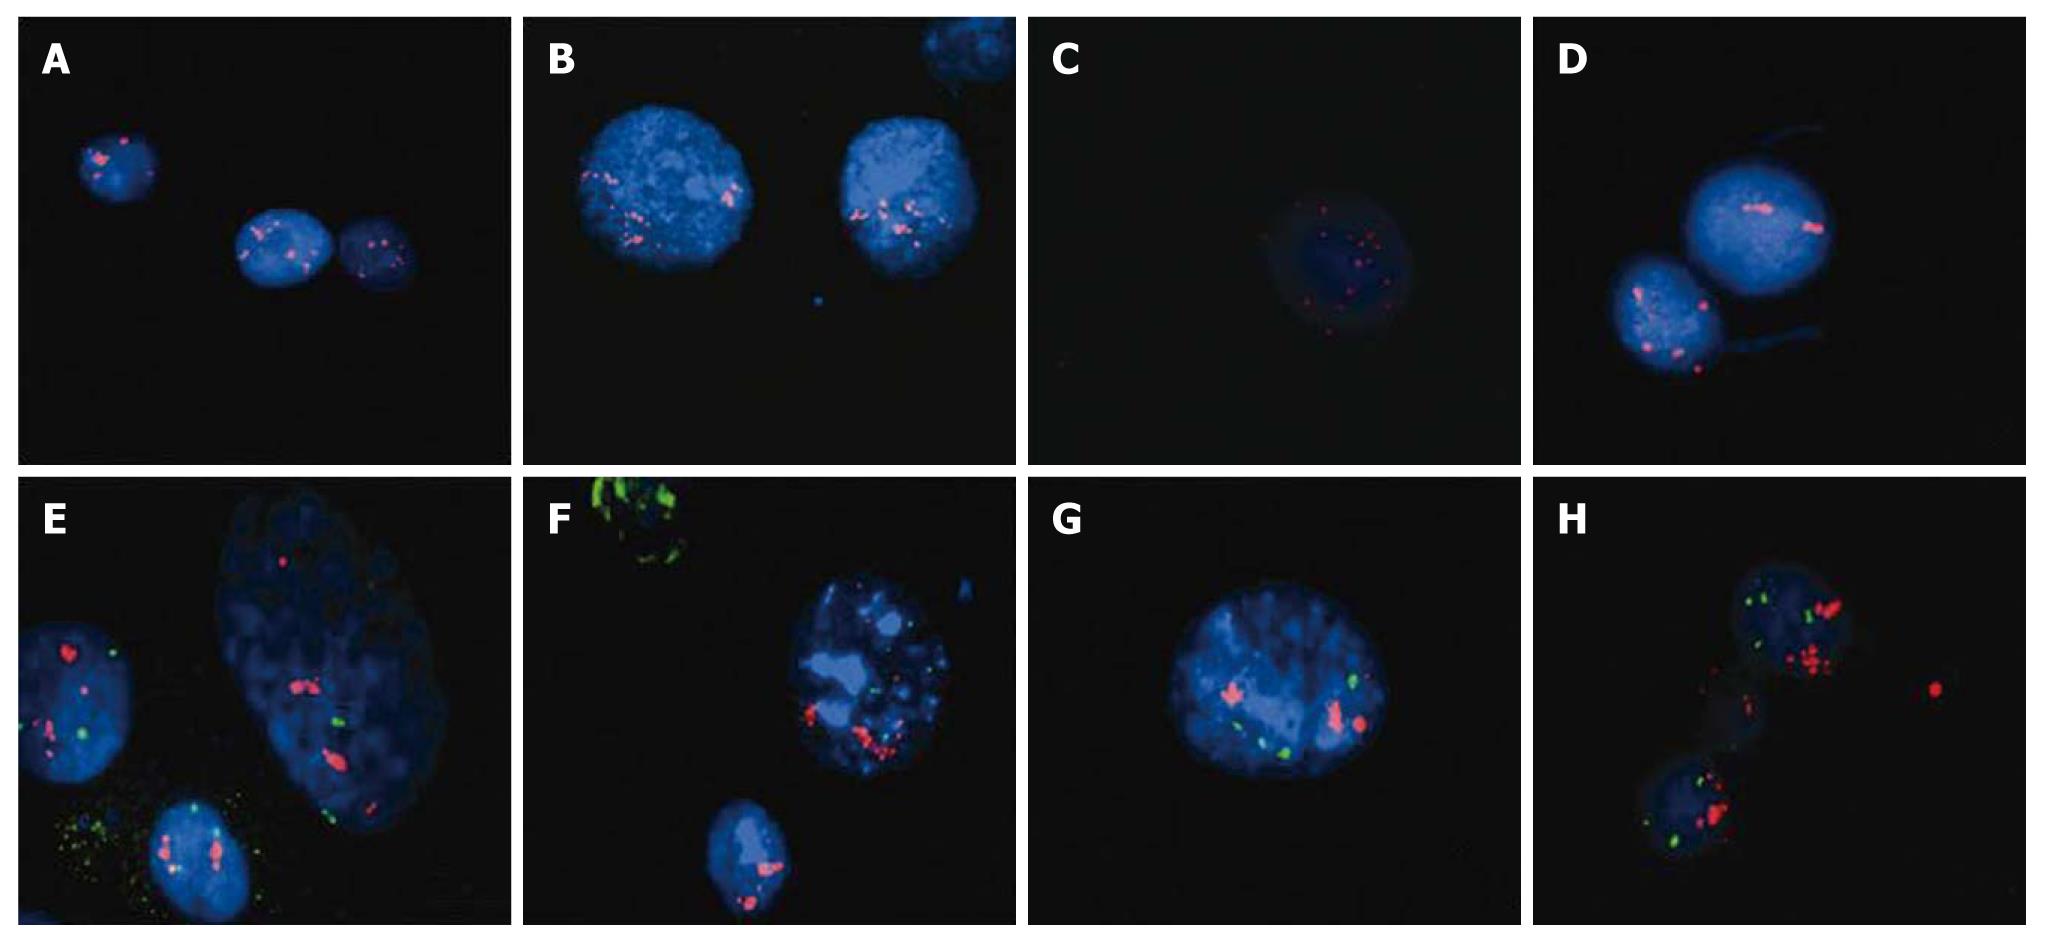
Figure 8 DAPI stained interphase nuclei hybridized with locus specific probes for C-MYC Spectrum Orange (red) (A-D) and CCND1 (red)/IGH (green) (E-H).
C-MYC amplification can be seen in cell lines WHCO1 (A), WHCO3 (B), WHCO5 (C) and SNO (D). CCND1 amplification was detected in cell lines WHCO3 (E), WHCO5 (F), WHCO6 (G) and SNO (H).
- Citation: Brown J, Bothma H, Veale R, Willem P. Genomic imbalances in esophageal carcinoma cell lines involve Wnt pathway genes. World J Gastroenterol 2011; 17(24): 2909-2923
- URL: https://www.wjgnet.com/1007-9327/full/v17/i24/2909.htm
- DOI: https://dx.doi.org/10.3748/wjg.v17.i24.2909


