Copyright
©2011 Baishideng Publishing Group Co.
World J Gastroenterol. Jan 14, 2011; 17(2): 164-173
Published online Jan 14, 2011. doi: 10.3748/wjg.v17.i2.164
Published online Jan 14, 2011. doi: 10.3748/wjg.v17.i2.164
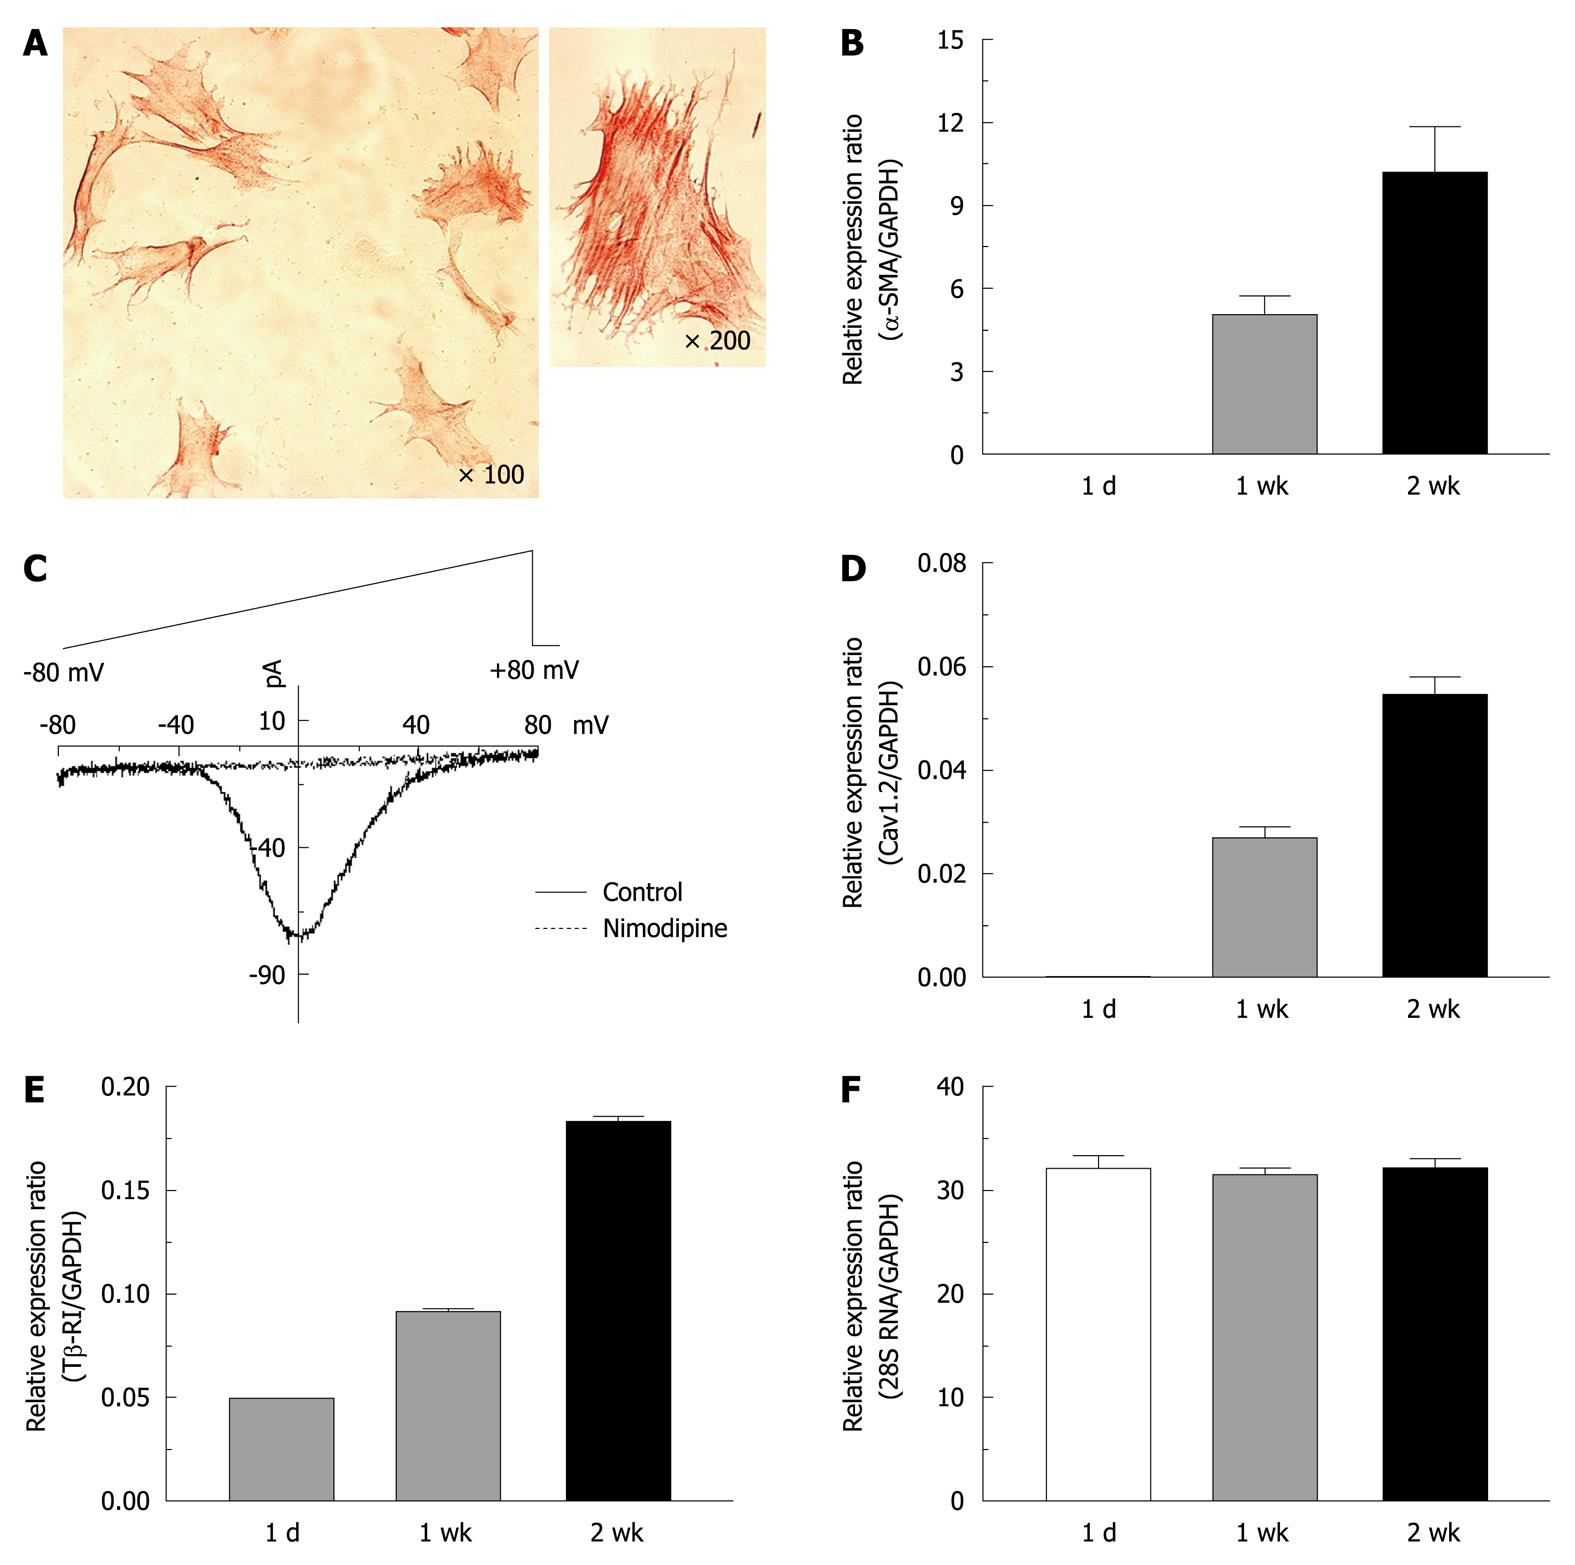
Figure 1 Expression of α-smooth muscle actin, L-type calcium channels and type 1 transforming growth factor-β receptors in activated rat hepatic stellate cells.
A: Immunocytochemical staining for α-smooth muscle actin (α-SMA) was performed on hepatic stellate cells (HSCs) cultured for 1 wk; C: Whole cell Ca2+ currents in a voltage-clamp mode were recorded from 2 wk-cultured HSCs, and were completely blocked by nimodipine (10 μmol/L); Changes in the transcript levels of α-SMA (B), the α1c subunit of the L-type Ca2+ channel (Cav1.2) (D), the type 1 receptor of transforming growth factor-β (Tβ-RI) (E), and 28S RNA (F) during HSC culturing (1 d, 1 wk and 2 wk) were measured by quantitative real-time reverse transcription-polymerase chain reaction analysis. Expression levels were normalized to glyceraldehyde-3-phosphate dehydrogenase (GAPDH) and expressed as a relative expression ratio (target/GAPDH). Data are presented as the mean ± SE (n = 3).
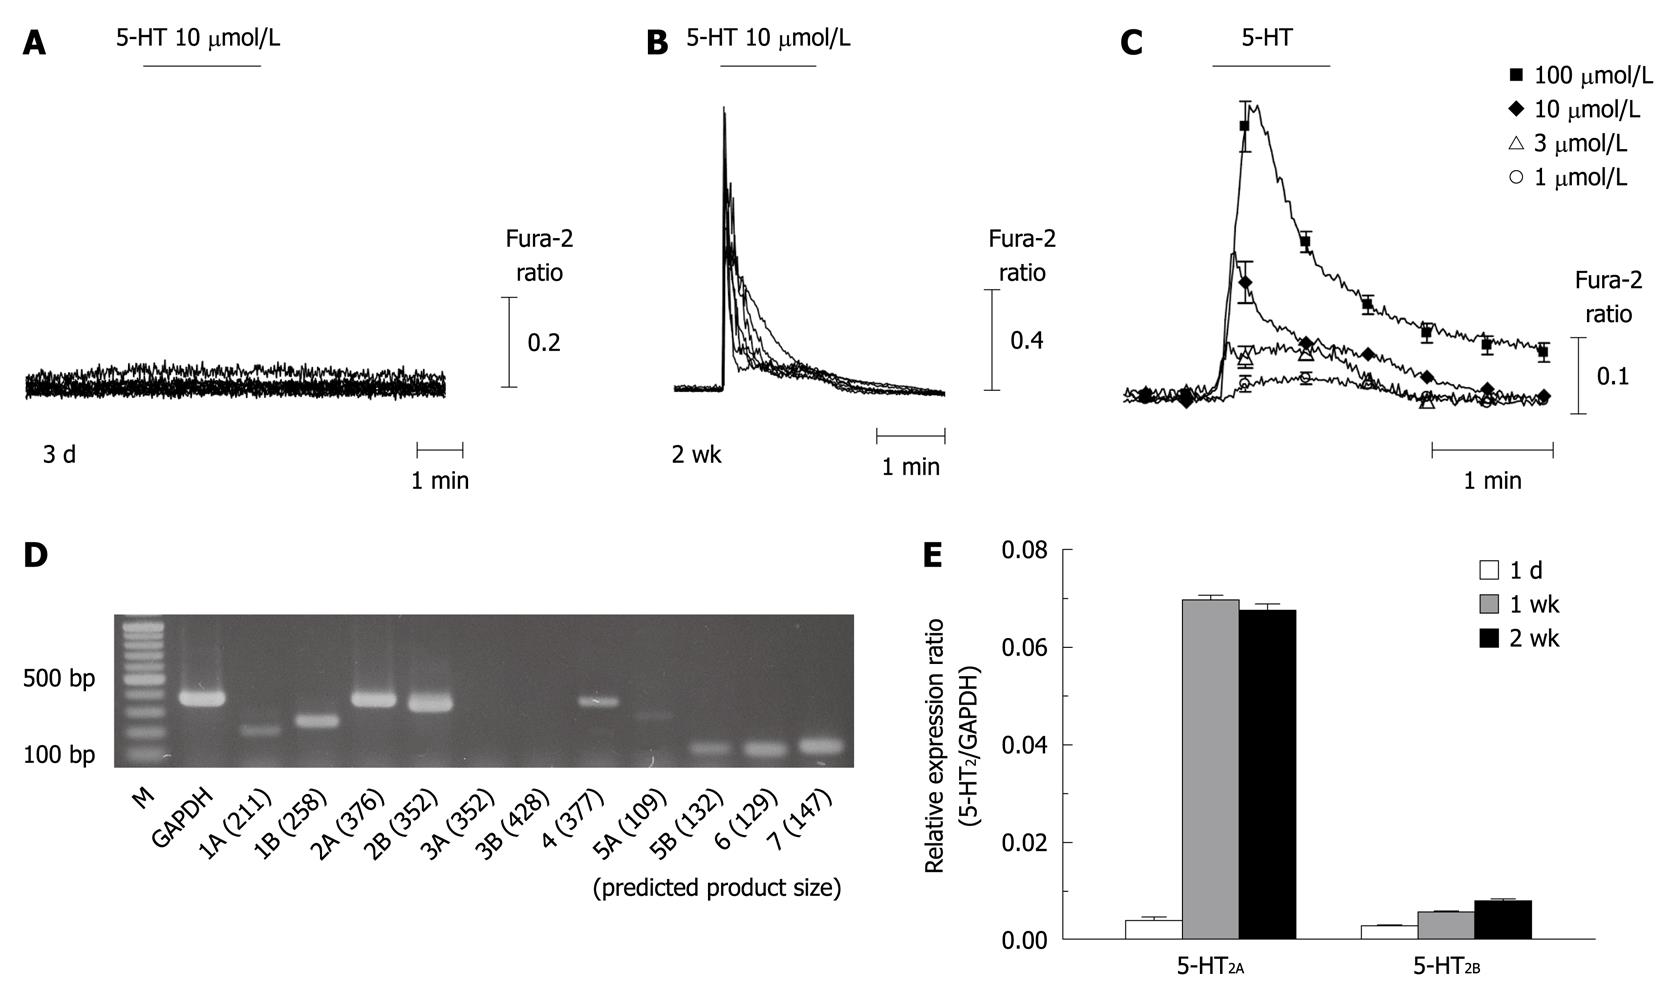
Figure 2 5-hydroxytryptamine-induced intracellular Ca2+ concentration changes and the expression of 5-hydroxytryptamine2 receptors in quiescent and activated hepatic stellate cells.
A, B: 5-hydroxytryptamine (5-HT)-induced intracellular Ca2+ concentration ([Ca2+]i) transients were recorded from hepatic stellate cells (HSCs) at 3 d (A) and 2 wk (B) after isolation; C: Averages of [Ca2+]i changes (from 13-40 cells/each trace) in response to 5-HT (1-100 μmol/L) application to 2 wk-cultured HSCs are shown; D: Steady-state mRNA levels of the 5-HT receptor isotypes in 2 wk-cultured HSCs were compared using reverse transcription-polymerase chain reaction (RT-PCR); E: Using quantitative RT-PCR, the transcriptional changes in 5-HT2 receptors among 1 d-, 1 wk- and 2 wk-cultured HSCs were compared. Expression levels were normalized to GAPDH and expressed as a relative expression ratio (target/GAPDH, n = 3). Data are presented as the mean ± SE.
Figure 3 Comparison of intracellular Ca2+ concentration responses to various metabotropic receptor agonists in activated hepatic stellate cells.
Intracellular Ca2+ concentration changes following application of ATP (100 μmol/L), 5-hydroxytryptamine (5-HT) (10 μmol/L), or acetylcholine (ACh, 10 μmol/L) were measured in 2 wk-cultured hepatic stellate cells (n = 3-6, 16-28 cells). Data are presented as the mean ± SE.
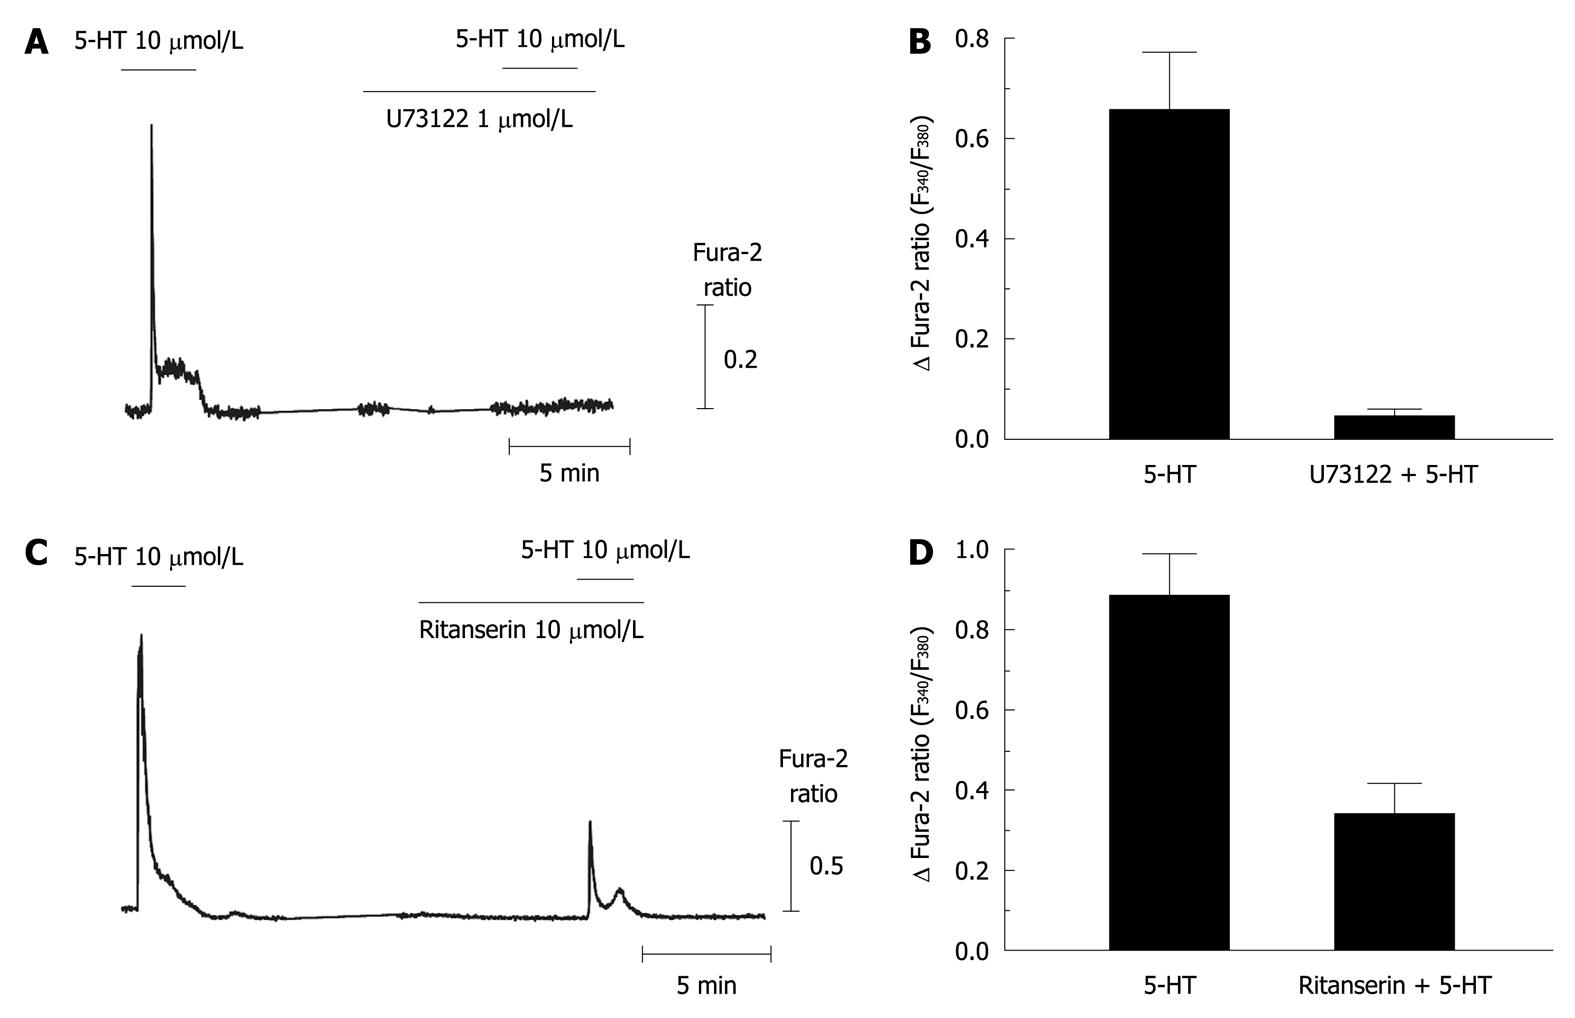
Figure 4 5-hydroxytryptamine-induced intracellular Ca2+ concentration transients via metabotropic 5-hydroxytryptamine2 receptor in activated hepatic stellate cells.
A, B: 5-hydroxytryptamine (5-HT)-induced intracellular Ca2+ concentration ([Ca2+]i) transients were completely abolished by pretreatment with U73122 (1 μmol/L), a phospholipase C blocker (n = 3, 11 cells); C, D: Ritanserin (10 μmol/L), a 5-HT2 antagonist, inhibited the [Ca2+]i responses to 5-HT in activated hepatic stellate cells (2 wk-cultured cells; n = 3, 13 cells). Data are presented as the mean ± SE.
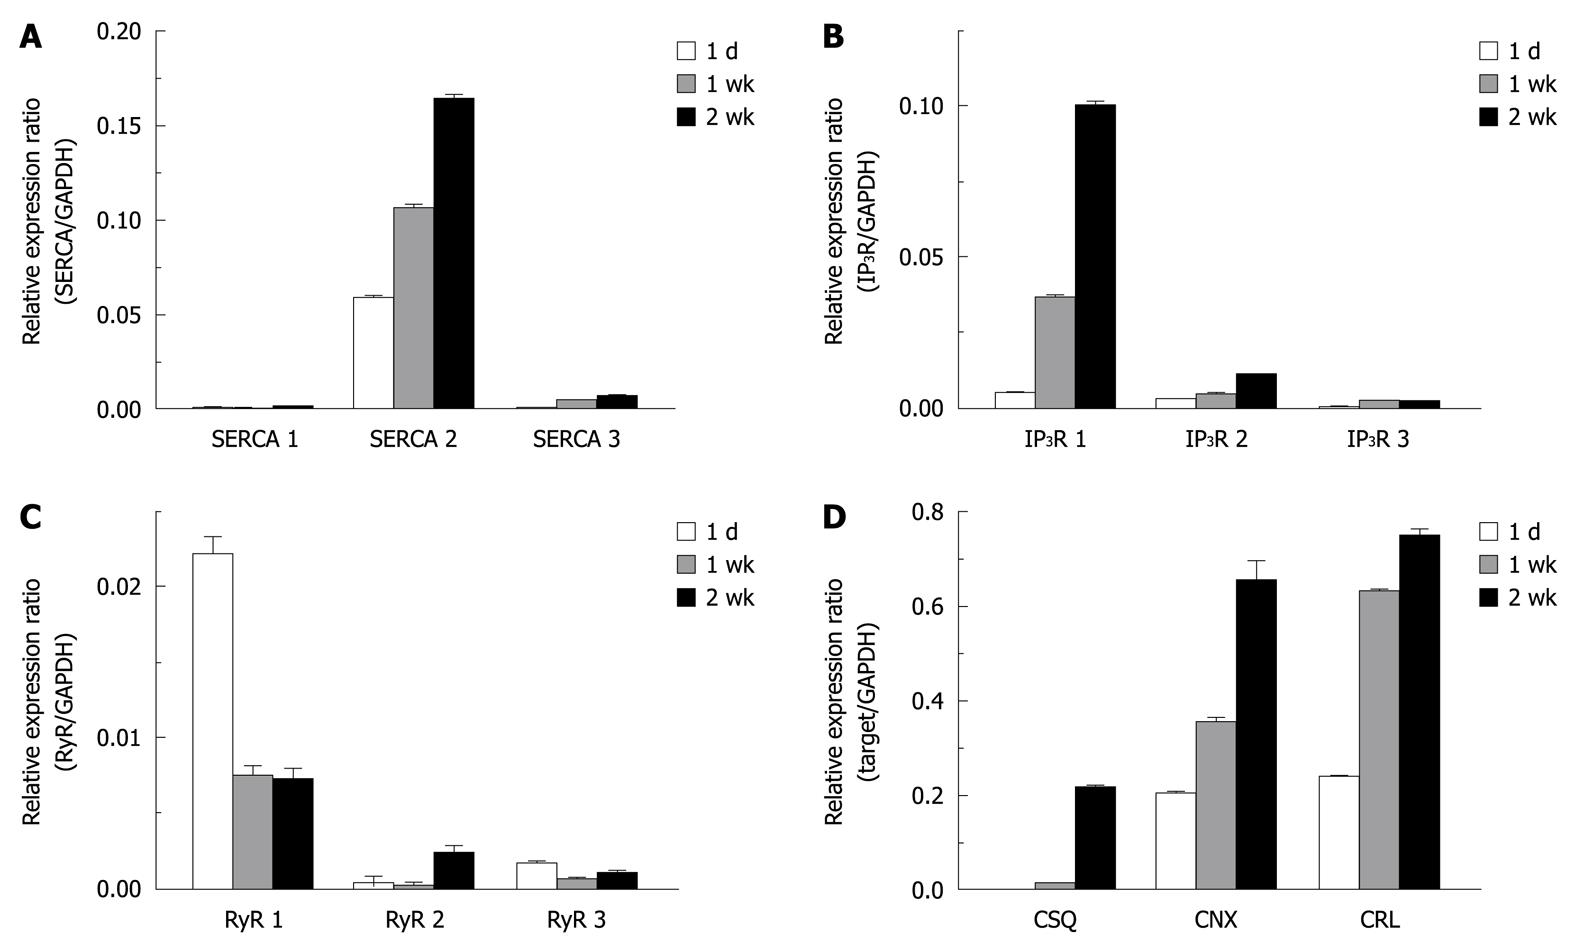
Figure 5 Up-regulation of endoplasmic reticulum Ca2+ transporting and binding proteins in activated hepatic stellate cells.
Changes in the expression level of 3 isoforms of the sarcoplasmic/endoplasmic reticulum Ca2+ ATPase (SERCA) (A), inositol triphosphate receptor (IP3R) (B), ryanodine receptor (RyR) (C) and Ca2+ binding chaperones (D) during the culture periods (1 d, 1 wk and 2 wk) were measured by quantitative real-time reverse transcription-polymerase chain reaction analysis. Expression levels were normalized to GAPDH and expressed as a relative expression ratio (target/GAPDH). Data are presented as the mean ± SE (n = 3). CSQ: Calsequestrin, CNX: Calnexin, and CRL: Calreticulin.
- Citation: Park KS, Sin PJ, Lee DH, Cha SK, Kim MJ, Kim NH, Baik SK, Jeong SW, Kong ID. Switching-on of serotonergic calcium signaling in activated hepatic stellate cells. World J Gastroenterol 2011; 17(2): 164-173
- URL: https://www.wjgnet.com/1007-9327/full/v17/i2/164.htm
- DOI: https://dx.doi.org/10.3748/wjg.v17.i2.164


