Copyright
©2011 Baishideng Publishing Group Co.
World J Gastroenterol. Jan 14, 2011; 17(2): 151-163
Published online Jan 14, 2011. doi: 10.3748/wjg.v17.i2.151
Published online Jan 14, 2011. doi: 10.3748/wjg.v17.i2.151
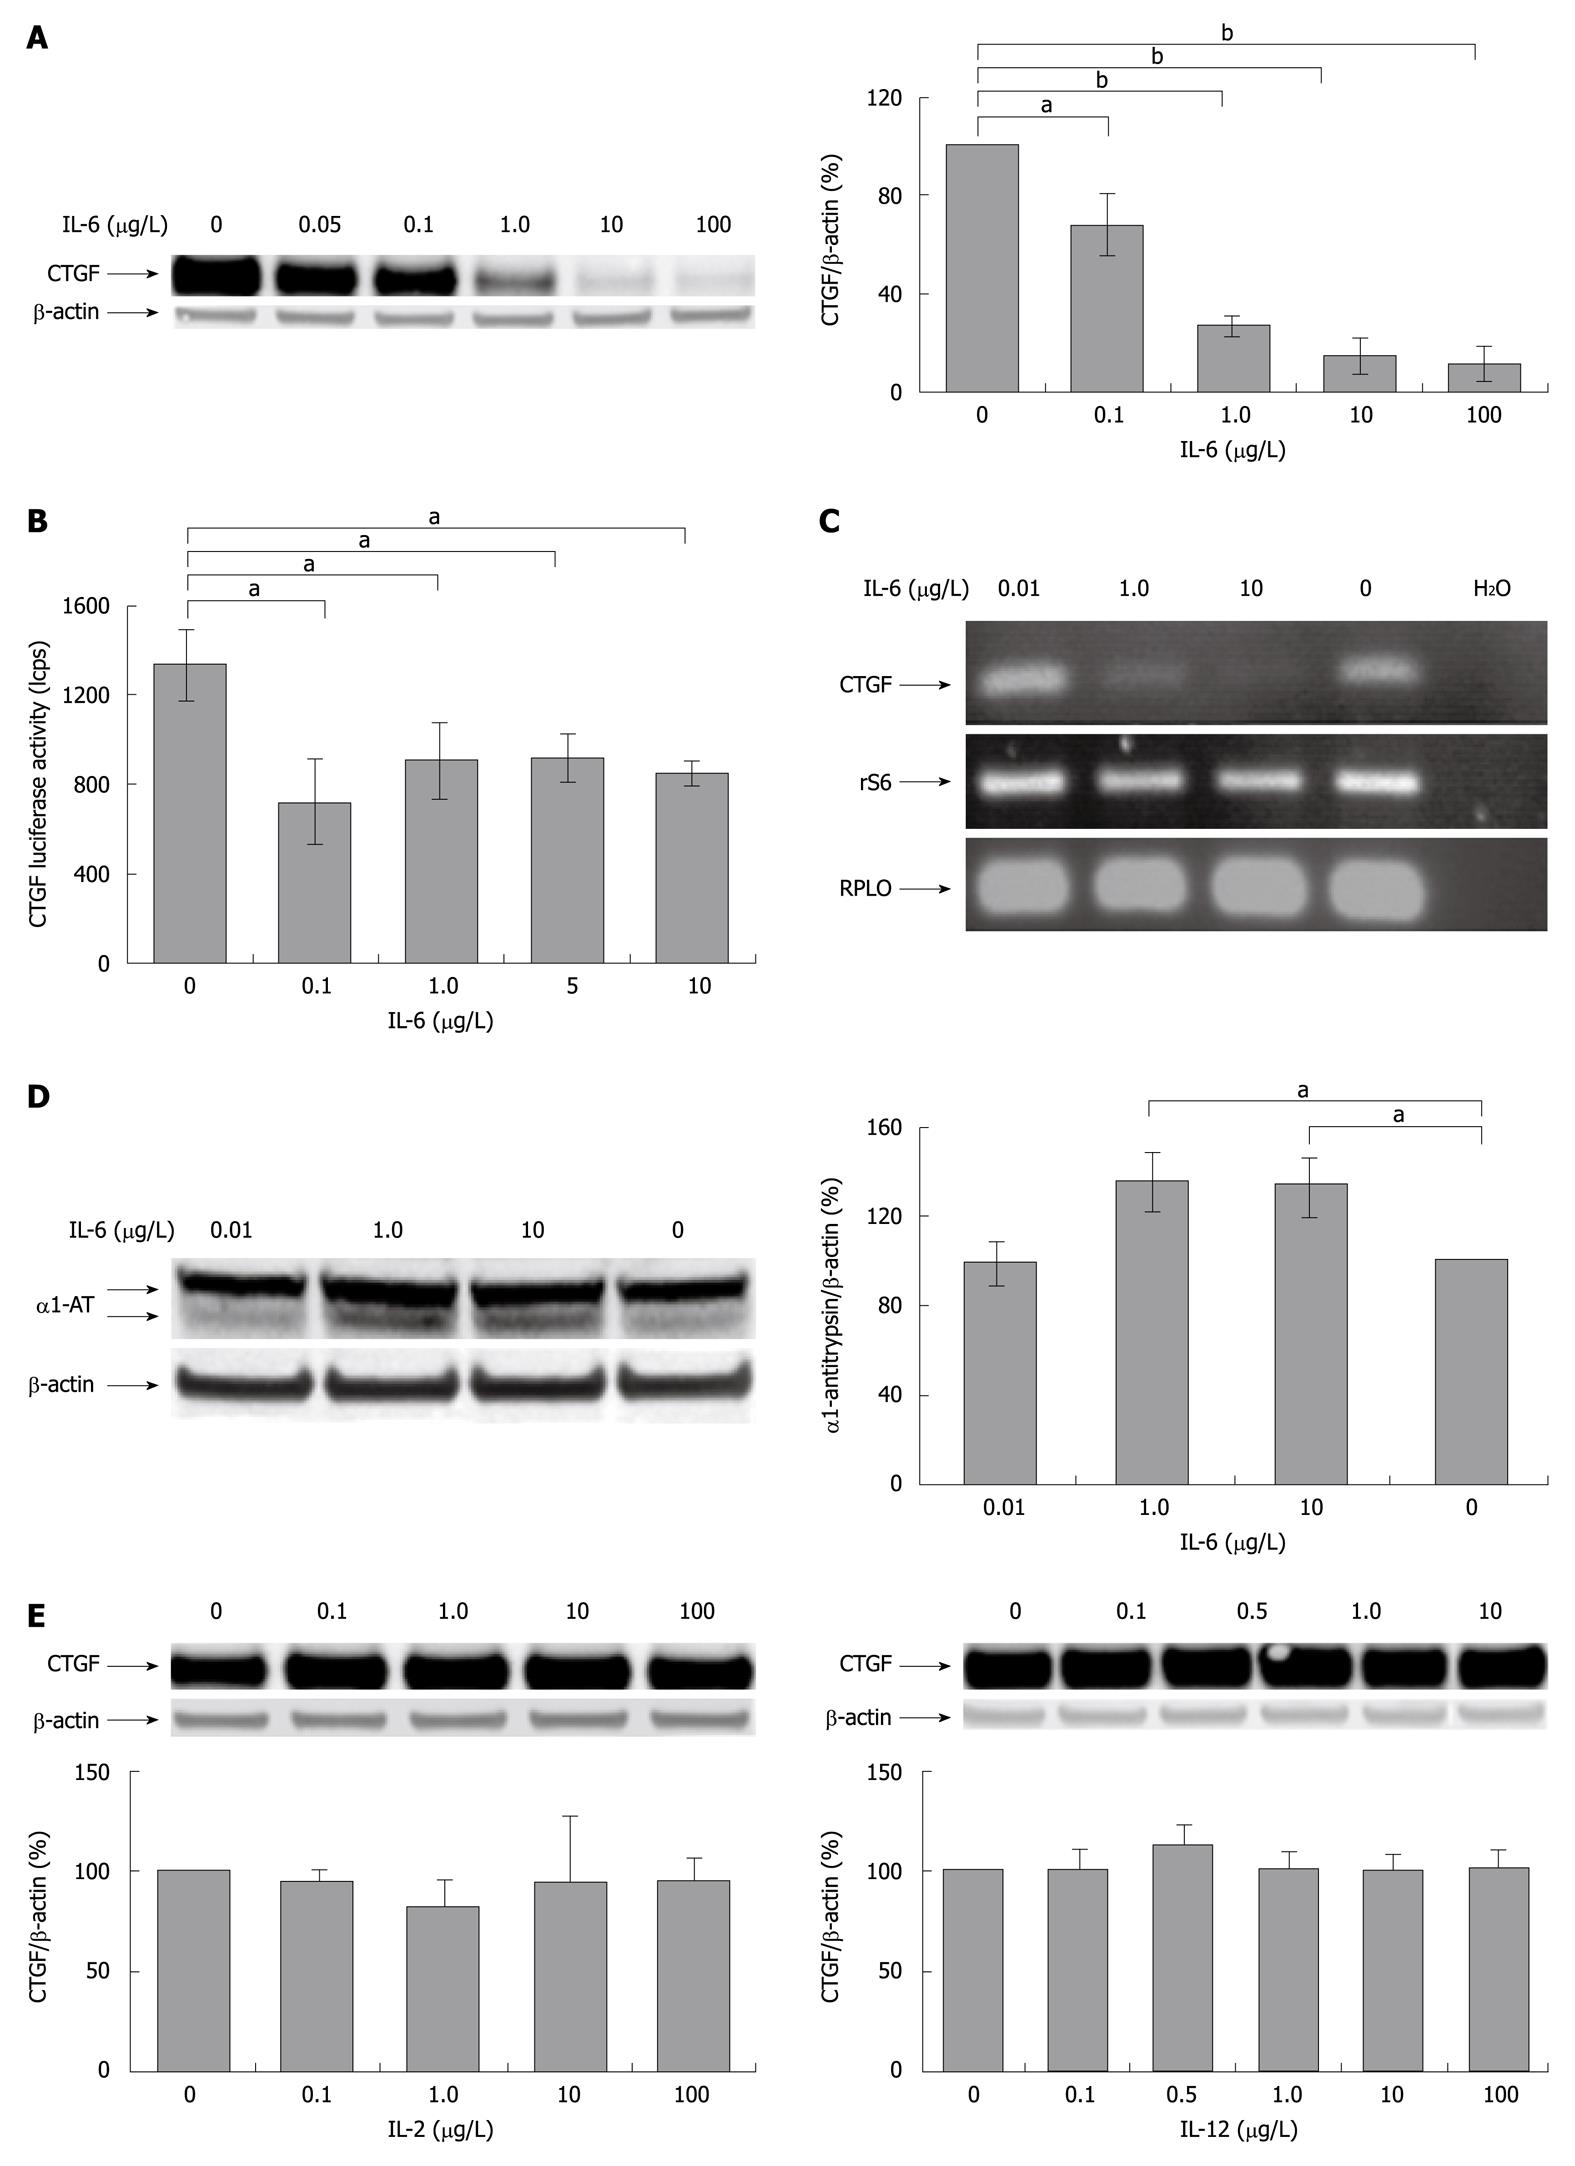
Figure 1 Interleukin-6 inhibits CYR61/CTGF/NOV 2/connective tissue growth factor expression in cultured rat hepatocytes.
A: Western blotting of CYR61-CTGF-NOV (CCN) 2/connective tissue growth factor (CTGF) of rat hepatocytes (PC) cultured for 24 h under serum-free conditions with or without addition of indicated concentrations of rr interleukin (rrIL)-6. β-actin served as loading control. A representative blot is shown. Blots were quantified relative to β-actin using the Lumi Imager System. Quantifications represent the mean ± SD of 3 independent cultures. aP < 0.05, bP < 0.0001 vs untreated control; B: CCN2/CTGF reporter gene activation. Rat PC were cultured in serum-free medium for 24 h and transfected with Ad-hCTGF-Luc then subjected to the indicated concentrations of rrIL-6 16 h after transfection and cultured for another 24 h before harvest. Mean values (± SD from 3 cultures) are shown. aP < 0.05 vs untreated control; C: Reverse-transcriptase polymerase chain reaction (RT-PCR) of CCN2/CTGF of rat PC. Rat PC were cultured in serum-free medium and treated with rrIL-6 at indicated concentrations for 24 h. RT-PCR was performed using primers for rat CCN2/CTGF as described in Materials and Methods. rS6 and RPLO served as internal control. A representative experiment of 3 independent cultures is shown; D: Western blotting of α1-AT of rat PC cultured for 24 h under serum-free conditions with or without addition of indicated concentrations of rrIL-6. A representative blot is shown. Blots were quantified as described in (A). aP < 0.05 vs untreated control; E: Western blottings of CCN2/CTGF of PC cultured for 24 h in serum-free medium with or without addition of indicated concentrations of IL-2 or IL-12. β-actin served as loading control. Representative blots of 3 independent experiments are shown. Blots were quantified as described in (A).
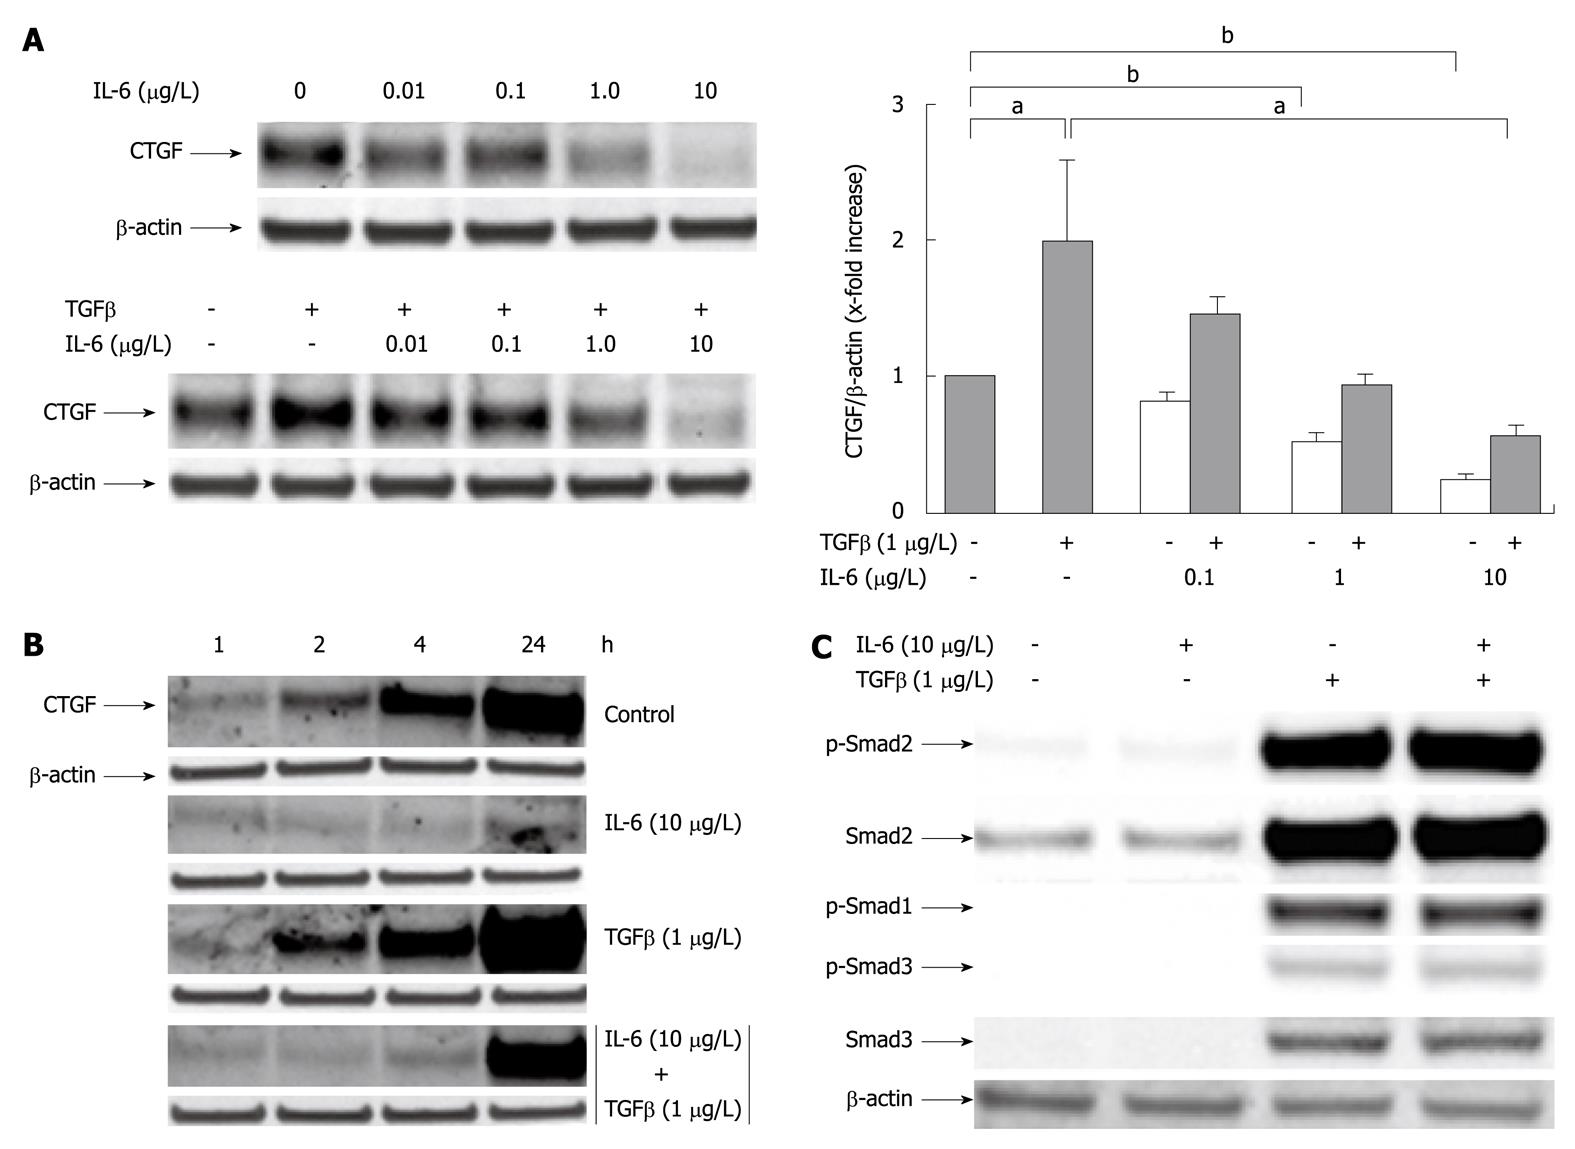
Figure 2 Interleukin-6 acts as an inhibitor of transforming growth factor β1 induced CYR61/CTGF/NOV 2/connective tissue growth factor protein expression in cultured rat hepatocytes.
A: Western blottings of CYR61/CTGF/NOV (CCN) 2/connective tissue growth factor (CTGF) of rat hepatocytes (PC) cultured under serum-free conditions with or without addition of rr interleukin (rrIL)-6 at indicated concentrations 30 min prior addition of rhTGFβ1 (1 μg/L). The cell culture only with IL-6 at indicated concentrations served as internal control. Cells were harvested after another 24 h. β-actin served as loading control. Representative blots are shown. Blots were quantified relative to β-actin using the Lumi Imager System. Quantifications represent the mean ± SD of 3 independent cultures. aP < 0.05, bP < 0.0001 vs untreated control; B: Western blottings of CCN2/CTGF of rat PC cultured as stated in (A) under serum-free conditions with or without addition of rrIL-6 (10 μg/L) 30 min prior addition of rhTGFβ1 (1 μg/L) where indicated. The cells were harvested after 1, 2, 4 and 24 h. β-actin served as loading control. A representative blot of 3 independent experiments is shown; C: Western blottings of phosphorylated and total Smad2 and Smad3, the latter antibody cross-reacting with Smad1. Rat PC were cultured for 24 h under serum-free conditions with or without addition of rh transforming growth factor (TGF) β1 (1 μg/L) and indicated concentrations of rrIL-6. Representative blots are shown.
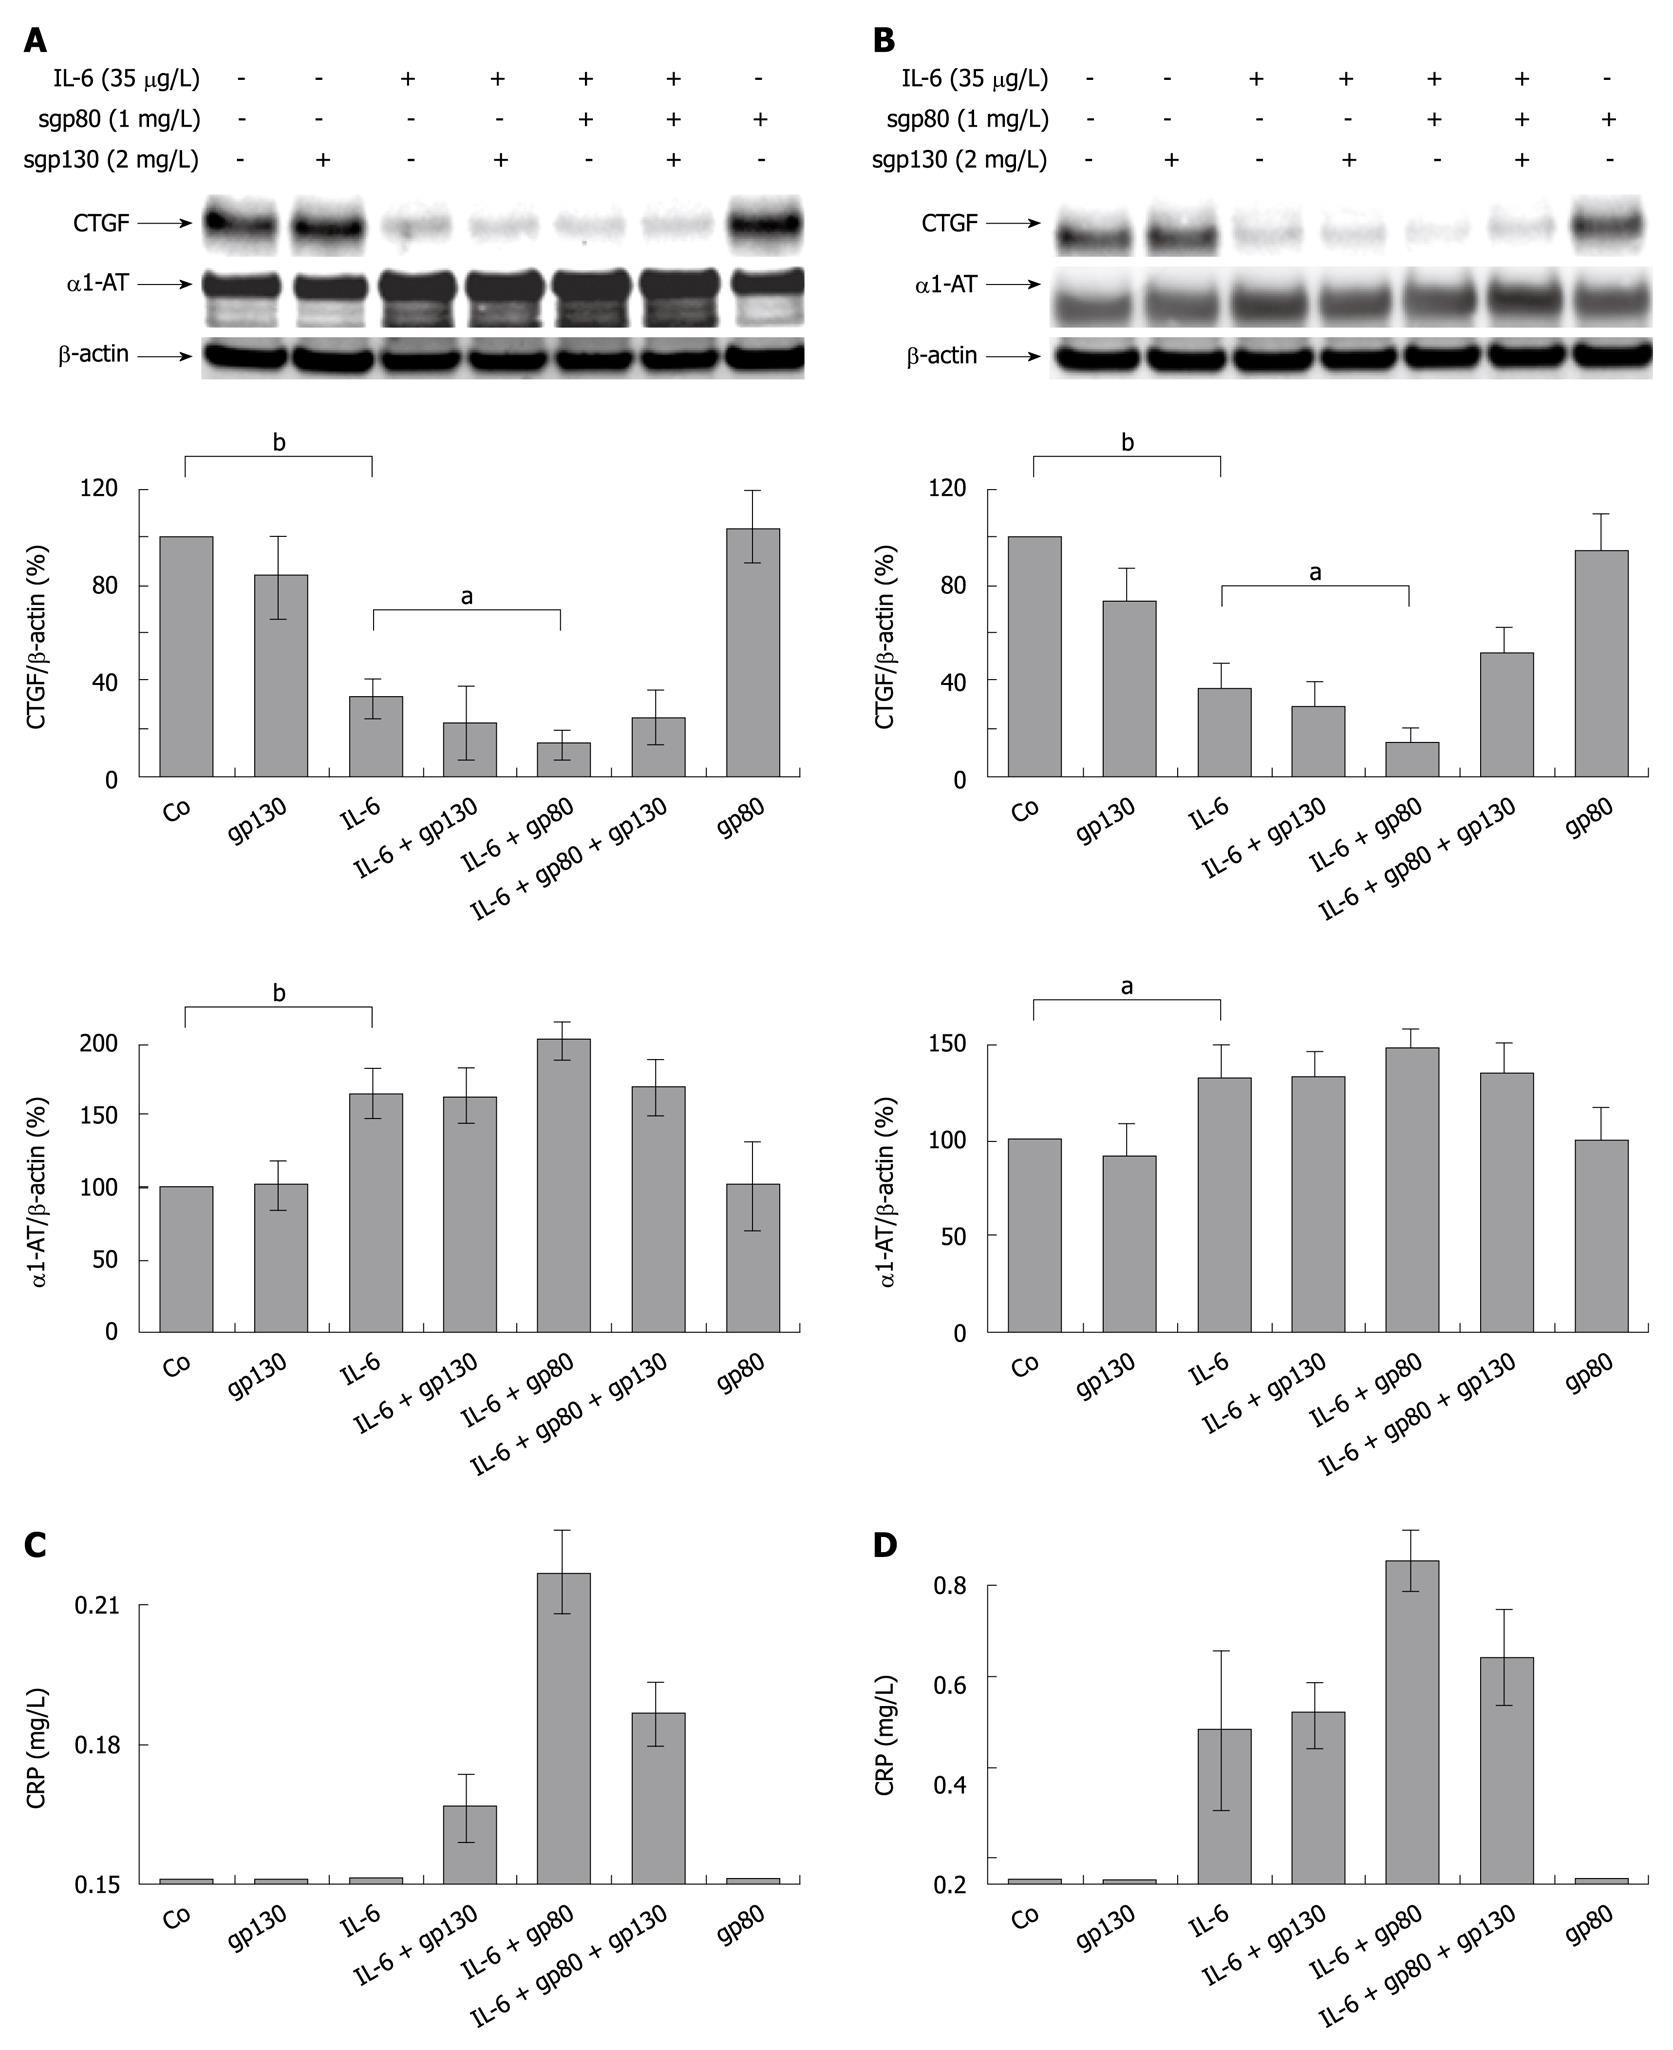
Figure 3 Soluble gp80 receptor enhances the inhibitory effect of interleukin-6 on hepatocellular CYR61/CTGF/NOV 2/connective tissue growth factor expression in primary human hepatocytes.
A: Western blottings of CYR61/CTGF/NOV (CCN) 2/Connective tissue growth factor (CTGF) and α1-AT of primary human hepatocytes cultured under serum-free conditions for 24 h and stimulated with rh interleukin (rhIL)-6 (35 μg/L), soluble gp80 receptor (sgp80, 1 mg/L) and soluble gp130 receptor (sgp130, 2 mg/L) or a complex of both. Cells were harvested after 24 h. β-actin served as loading control. Blots were quantified relative to β-actin using the Lumi Imager System. Representative blots are shown. aP < 0.005, bP < 0.0001 vs untreated or IL-6 treated control; B: Primary human hepatocytes were cultured and stimulated as described in (A). Cells were harvested after 48 h. β-actin served as loading control. Blots were quantified as described in (A). Representative blots are shown. aP < 0.005, bP < 0.0001 vs untreated or IL-6 treated control; C, D: Ultrasensitive C-reactive Protein as determined using a particle enhanced ultra sensitive assay on the Siemens BN2 nephelometer in supernatants from primary human hepatocytes cultures harvested after 24 h (C) and 48 h (D). The baseline indicates the lower detection limit of the assay at 0.15 mg/L.
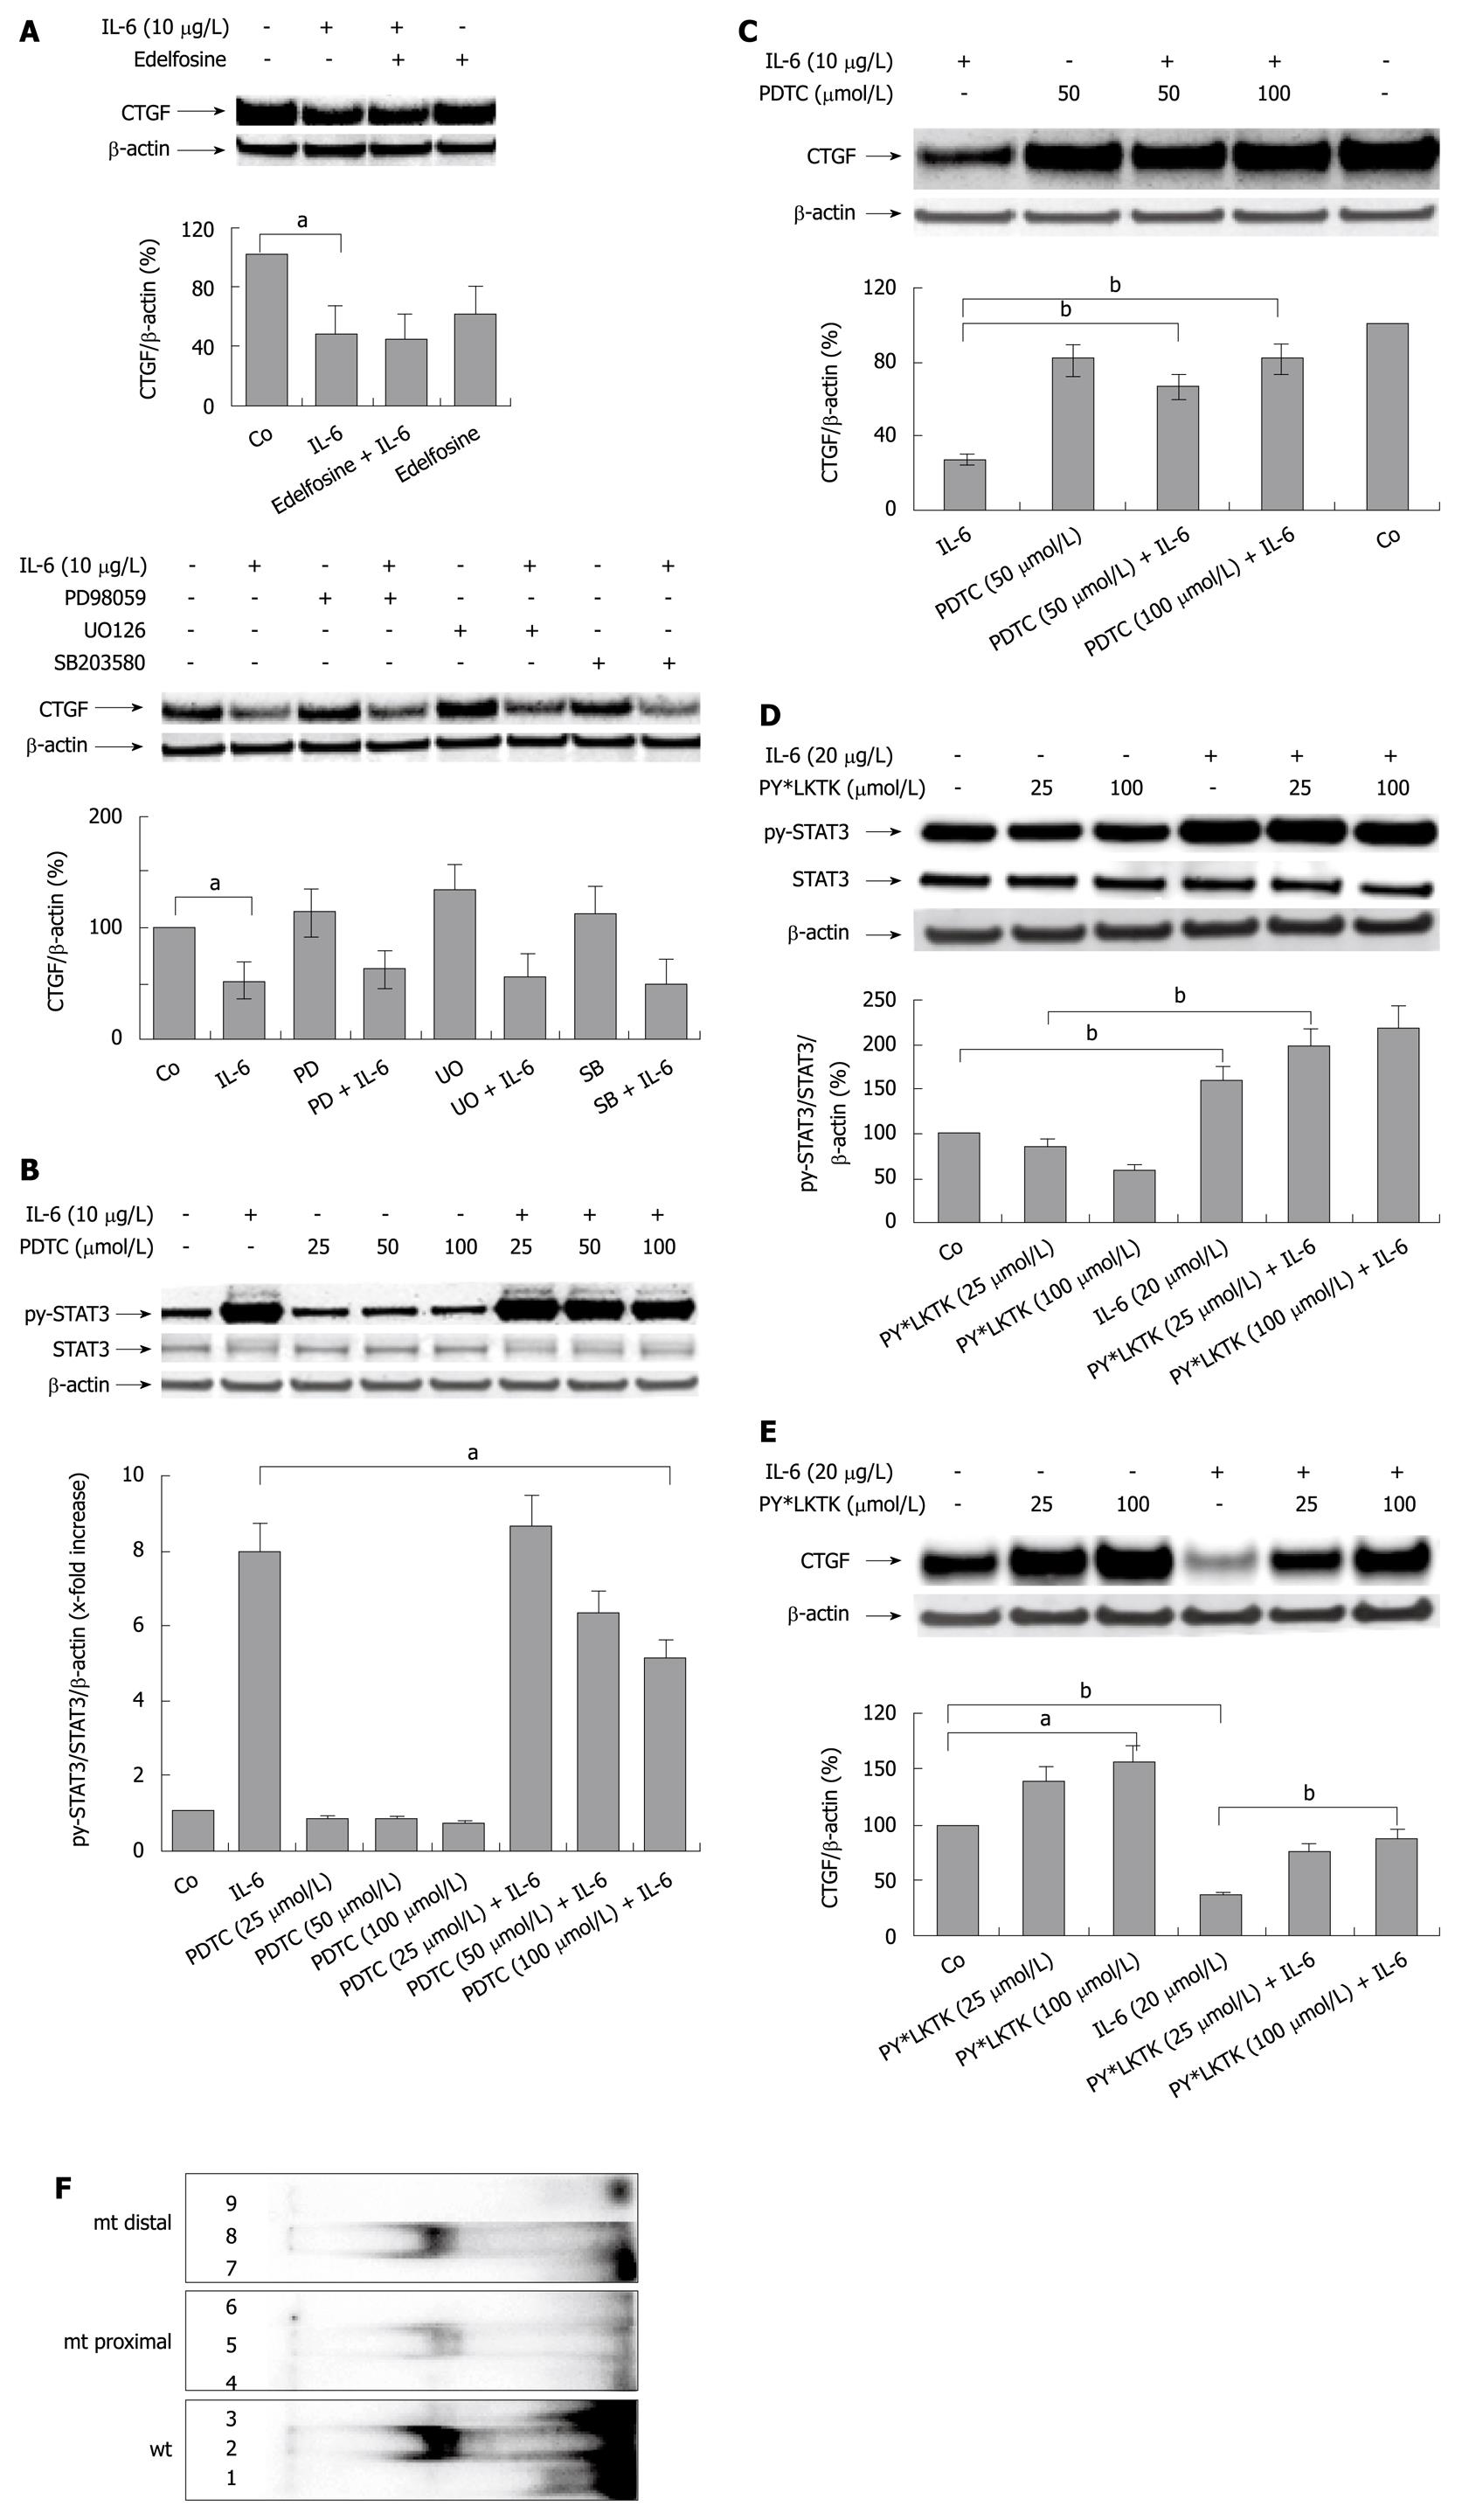
Figure 4 Interleukin-6 mediates its inhibitory effect on hepatocellular CYR61/CTGF/NOV 2/connective tissue growth factor expression through activation of the STAT3 pathway.
A: Western blottings ofCYR61/CTGF/NOV (CCN) 2/connective tissue growth factor (CTGF) of rat hepatocytes (PC) cultured under serum-free conditions with or without addition of the phosphatidylinositol phospholipase C inhibitor edelfosine (10 μmol/L, above) or specific MAP-Kinase inhibitors PD98059 (30 μmol/L), UO126, (10 μmol/L), as well as SB203580, (30 μmol/L) (below) administered to the culture medium 30 min before the addition of rr interleukin (IL)-6 (10 μg/L). Cells were harvested after 24 h. β-actin served as loading control. Blots were quantified relative to β-actin using the Lumi Imager System. A representative blot of 3 independent experiments is shown. aP < 0.005. PD: PD98059; SB: SB203580; UO: UO126; B: Western blottings of phosphorylated and total STAT3 of rat PC cultured under serum-free conditions with or without addition of PDTC at indicated concentrations 2 h prior addition of rrIL-6 (10 μg/L). Cells were harvested after 30 min. β-actin served as loading control. Representative blots of 3 independent cultures are shown. Blots were quantified relative to β-actin using the Lumi Imager System. Quantifications represent the mean ± SD of 3 independent cultures. aP < 0.05 vs IL-6 treated (PDTC untreated) control; C: Western blottings of CCN2/CTGF of rat PC cultured under serum-free conditions with or without addition of PDTC at indicated concentrations 2 h prior addition of rrIL-6 (10 μg/L). Cells were harvested after another 2 h. β-actin served as loading control. A representative blot out of 3 is shown. Blots were quantified as described in (A). bP < 0.0001 vs IL-6 treated (PDTC untreated) control; D: Western blottings of PY-STAT3 and STAT3 of rat PC cultured under serum-free conditions with or without addition of PY*LKTK at indicated concentrations 1 h prior addition of rrIL-6 (20 μg/L). Cells were harvested after another 30 min. β-actin served as loading control. Blots were quantified relative to β-actin using the Lumi Imager System. A representative blot out of 3 is shown. bP < 0.0001; E: Western blottings of CCN2/CTGF of rat PC cultured under serum-free conditions with or without addition of PY*LKTK at indicated concentrations 1 h prior addition of rrIL-6 (20 μg/L). Cells were harvested after another 24 h. β-actin served as loading control. Blots were quantified relative to β-actin using the Lumi Imager System. A representative blot out of 3 is shown. aP < 0.005, bP < 0.0001; F: EMSA using nuclear lysates of PC treated with rrIL-6 (10 μg/L; 30 min) and 32P-labeled double-stranded oligonucleotide probes containing the two proposed wild-type (wt) STAT binding sites as well as the mutated (mt) proximal and distal STAT binding sites in the CTGF promoter. Lane 1: Labeled probe containing both proposed STAT binding sites; lane 2: Nuclear extract and labeled probe containing both proposed STAT binding sites (wt); lane 3: Nuclear extract, labeled probe and 100-fold molar excess of unlabeled probe containing both proposed STAT binding sites (wt); lane 4: Labeled mutated (mt, proximal) probe; lane 5: Nuclear extract and labeled mutated (mt, proximal) probe; lane 6: Nuclear extract, labeled mutated (mt, proximal) probe and 100-fold molar excess of unlabeled mutated (mt, proximal) probe; lane 7: Labeled mutated (mt, distal) probe; lane 8: Nuclear extract and labeled mutated (mt, distal) probe; lane 9: Nuclear extract, labeled mutated (mt, distal) probe and 100-fold molar excess of unlabeled mutated (mt, proximal) probe. The following specific activities were determined using scintillation counting: wt double strand oligonucleotide, 5.23 × 10⁷ cpm/μg DNA; mt proximal oligonucleotide, 3.70 × 10⁷ cpm/μg DNA; mt distal oligonucleotide, 3.73 × 10⁷ cpm/μg DNA. The activities put on the gel were: wt double strand oligonucleotide, 33090 cpm; mt proximal oligonucleotide, 45 844 cpm; mt distal oligonucleotide, 31 556 cpm.
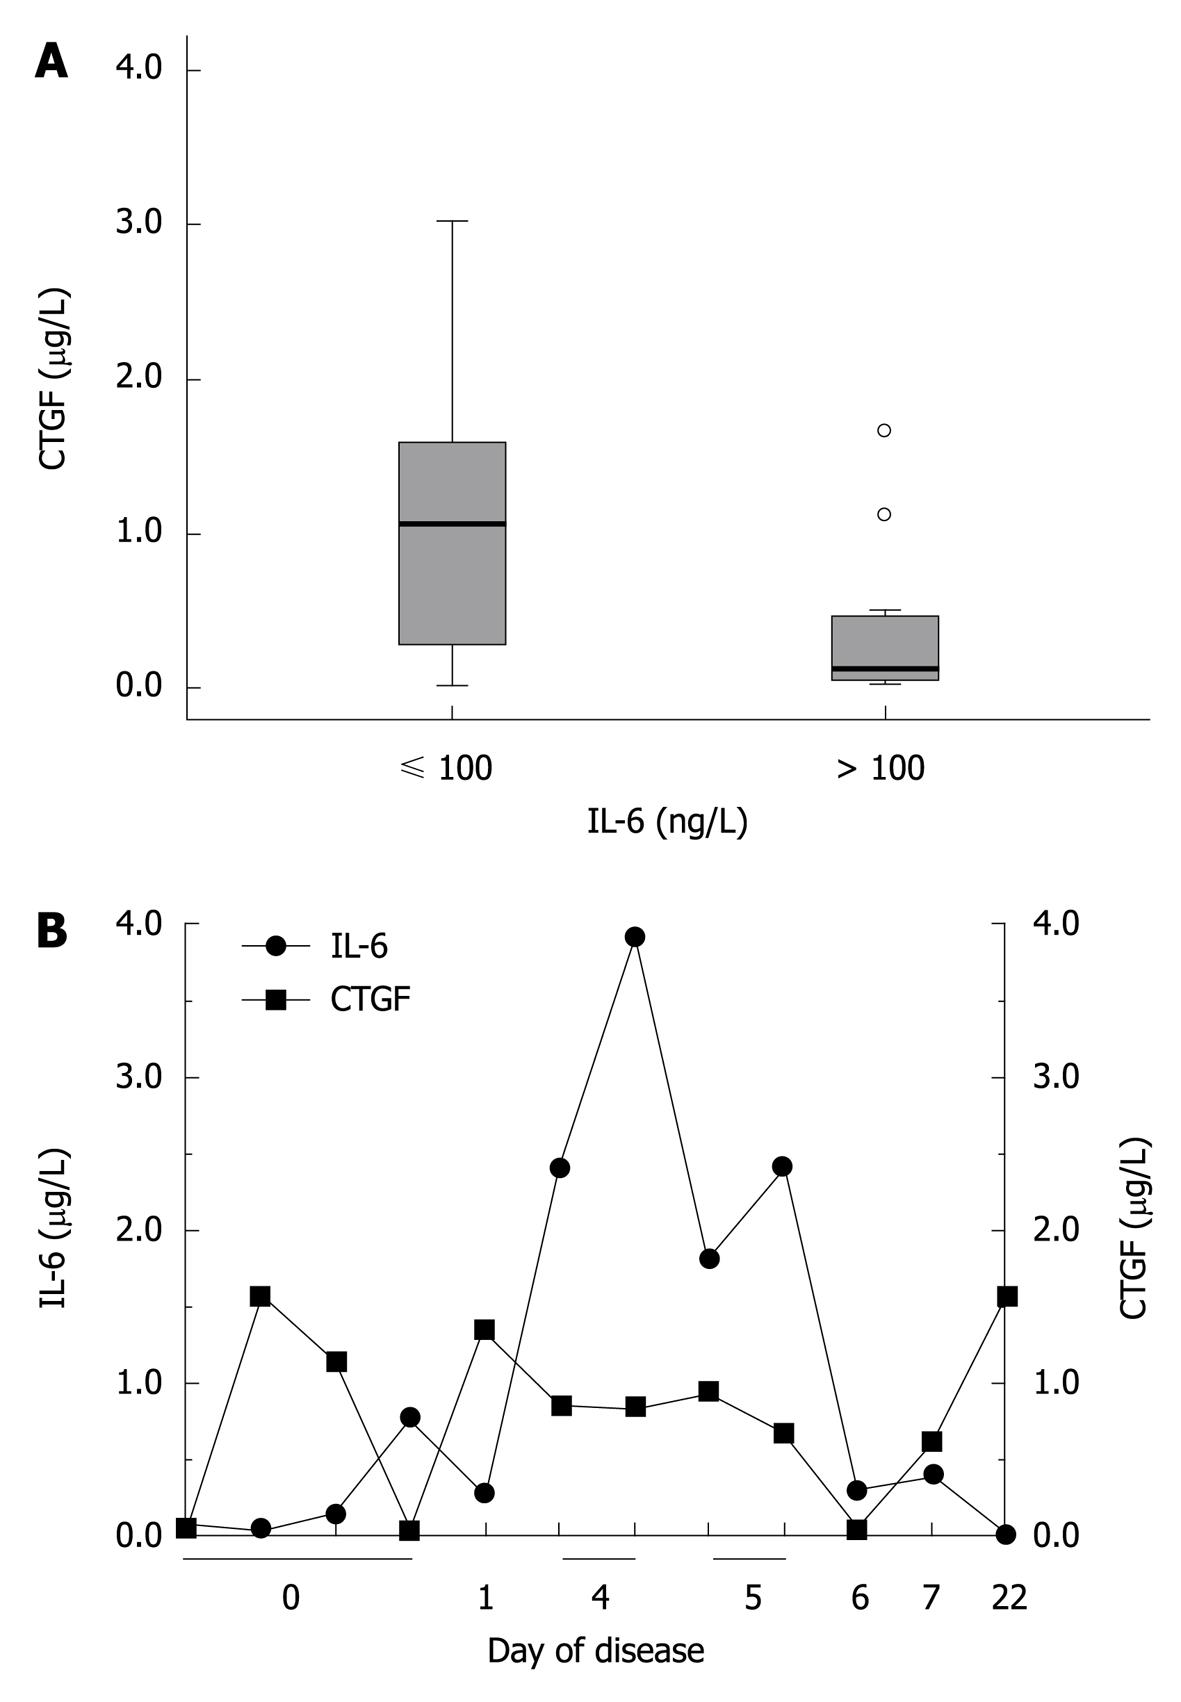
Figure 5 Inverse relation of interleukin-6 and CYR61/CTGF/NOV 2/connective tissue growth factor serum concentrations in patients with different severity of an acute phase reaction.
A: Patients (n = 36) were categorized according to their interleukin (IL)-6 serum concentrations. Corresponding CYR61/CTGF/NOV (CCN) 2/connective tissue growth factor (CTGF) concentrations were significantly lower in patients with high IL-6 serum concentrations (IL-6 > 100 ng/L, n = 15) compared to those with low IL-6 serum concentrations (IL-6 ≤ 100 ng/L, n = 21). Box plot are displayed, where the dotted line indicates the median per group, the box represents 50% of the values, and horizontal lines show minimum and maximum values of the calculated non-outlier values; open circles indicate outlier values; B: Longitudinal development of CCN2/CTGF and IL-6 serum concentrations in one representative individual patient (20 years old, male) over a time period of 22 d.
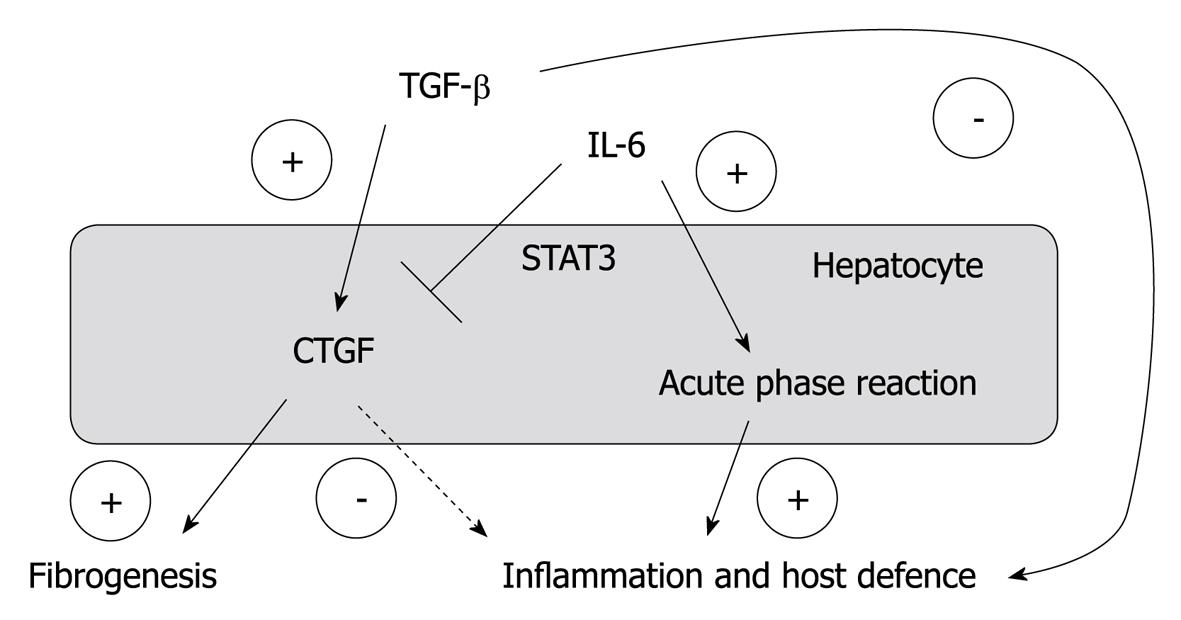
Figure 6 A simplified and schematic overview of the proposed interplay of interleukin-6 and tissue growth factor β1 on the regulation of CYR61/CTGF/NOV 2/connective tissue growth factor expression in hepatocytes and its relevance for inflammation, host defence and fibrogenesis in chronic liver disease.
CTGF: Connective tissue growth factor; IL-6: Interleukin-6; TGF: Transforming growth factor.
- Citation: Gressner OA, Peredniene I, Gressner AM. Connective tissue growth factor reacts as an IL-6/STAT3-regulated hepatic negative acute phase protein. World J Gastroenterol 2011; 17(2): 151-163
- URL: https://www.wjgnet.com/1007-9327/full/v17/i2/151.htm
- DOI: https://dx.doi.org/10.3748/wjg.v17.i2.151


