Copyright
©2011 Baishideng Publishing Group Co.
World J Gastroenterol. May 21, 2011; 17(19): 2379-2388
Published online May 21, 2011. doi: 10.3748/wjg.v17.i19.2379
Published online May 21, 2011. doi: 10.3748/wjg.v17.i19.2379
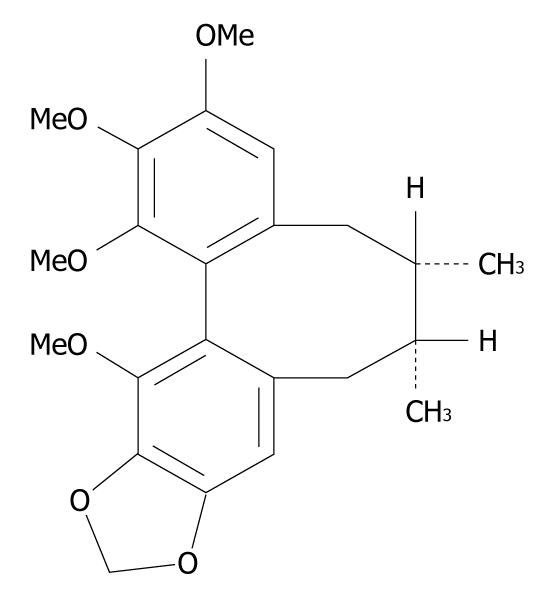
Figure 1 Chemical structure of schisandrin B.
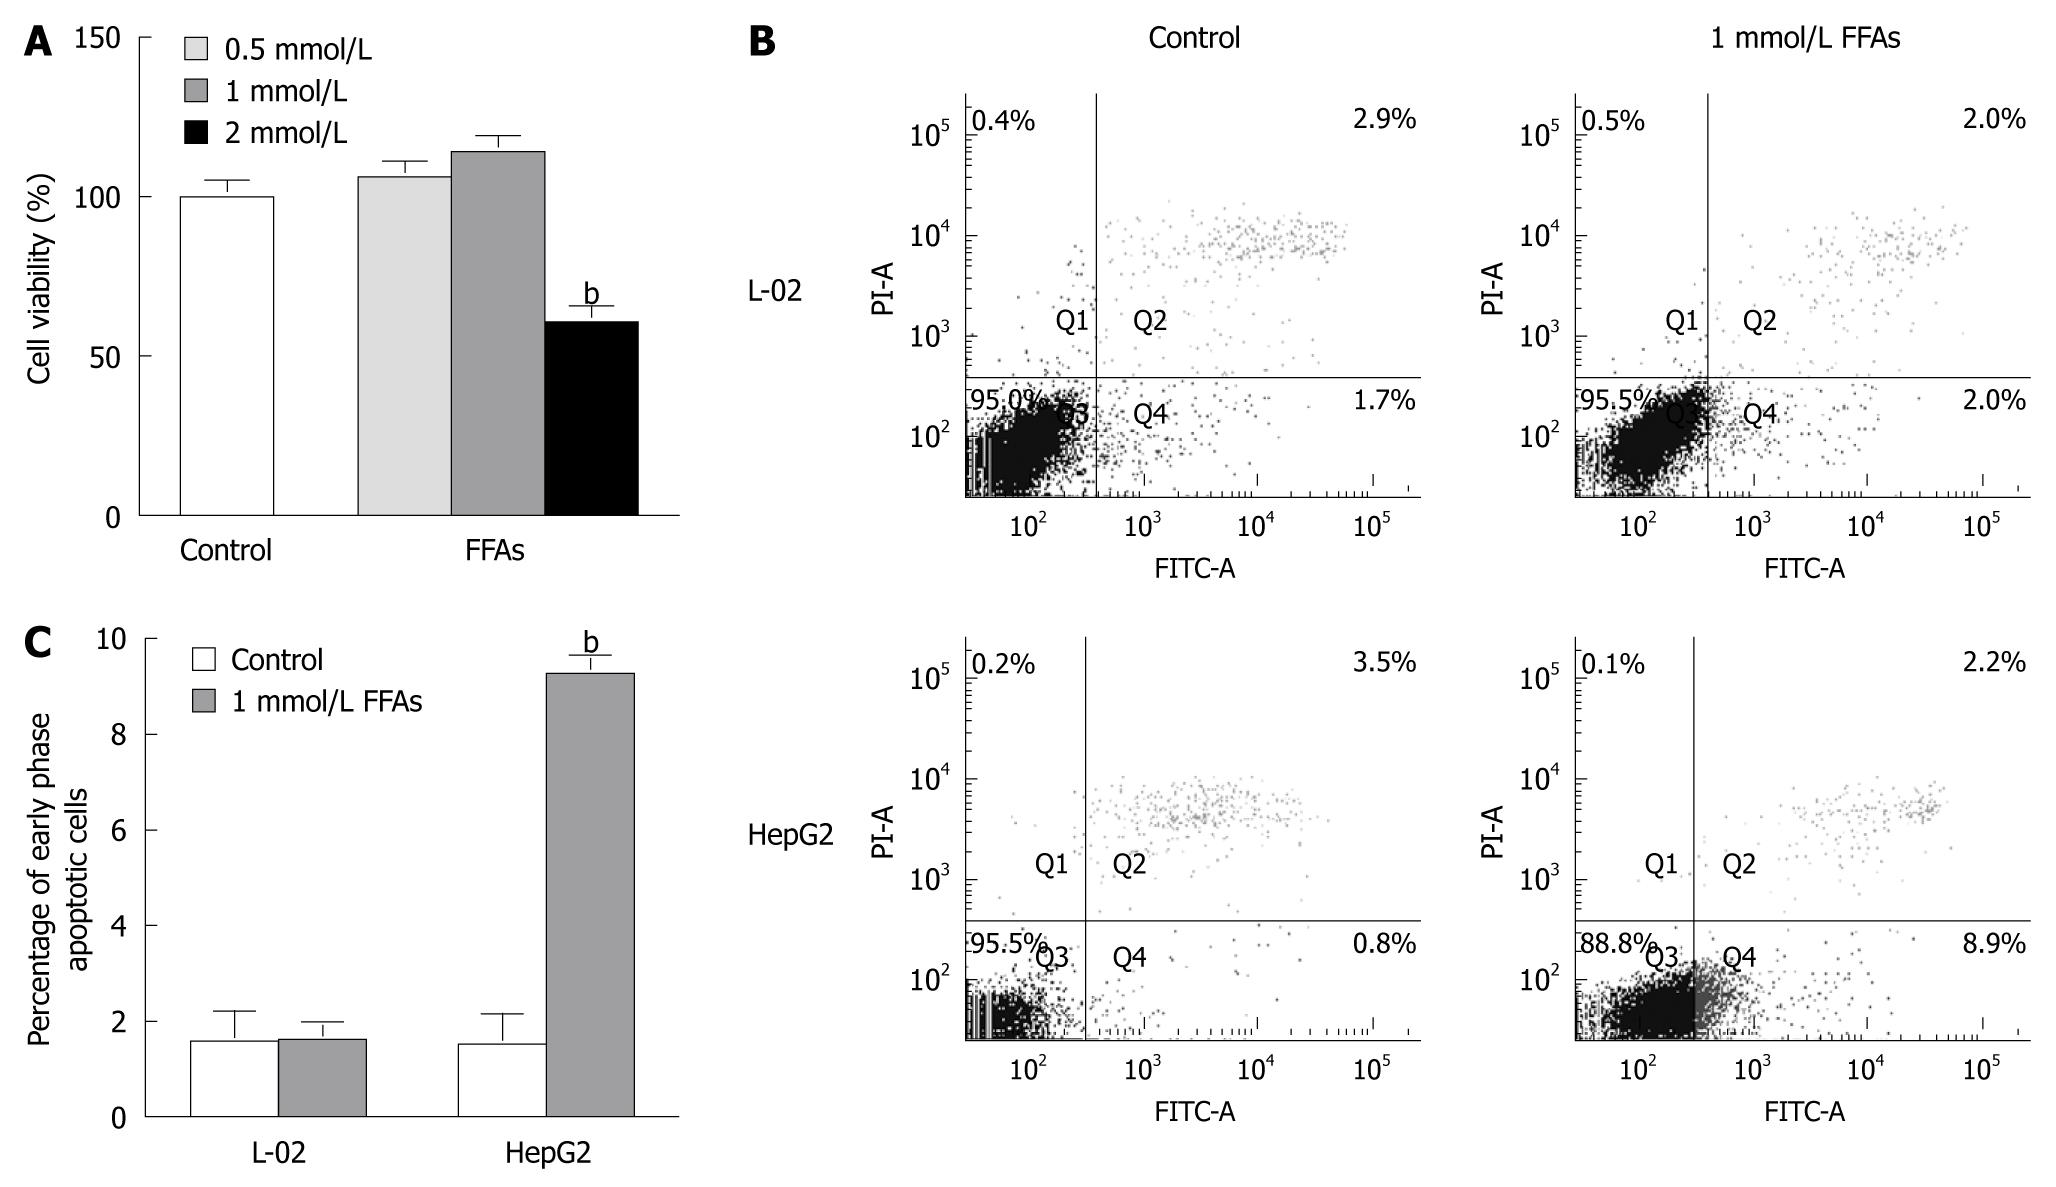
Figure 2 Cytotoxic and apoptotic effects of free fatty acid treatment on cultured cells.
A: L-02 cells were treated with a free fatty acid (FFA) mixture (oleate and palmitate at the ratio of 2:1) at various concentrations for 24 h. Cell viability was determined by the 3-(4,5)-dimethylthiahiazo (-z-y1)-3,5-di- phenytetrazoliumromide (MTT) assay. bP < 0.01 vs control group; B: L-02 and HepG2 cells were treated with 1 mmol/L FFA mixture (oleate and palmitate at the ratio of 2:1) for 24 h and stained with Annexin V-fluorescein isothiocyanate (FITC) and propidium iodide. Apoptotic and necrotic cells were monitored by flow cytometry. Normal, early and late apoptotic cells as well as necrotic cells were shown in Q3, Q4, Q2 and Q1 quadrants, respectively. The percentage of cells in each quadrant was displayed. Results were the representative of three independent experiments; C: Quantification of early phase apoptotic cells in response to FFA treatment. bP < 0.01 vs HepG2 control group.
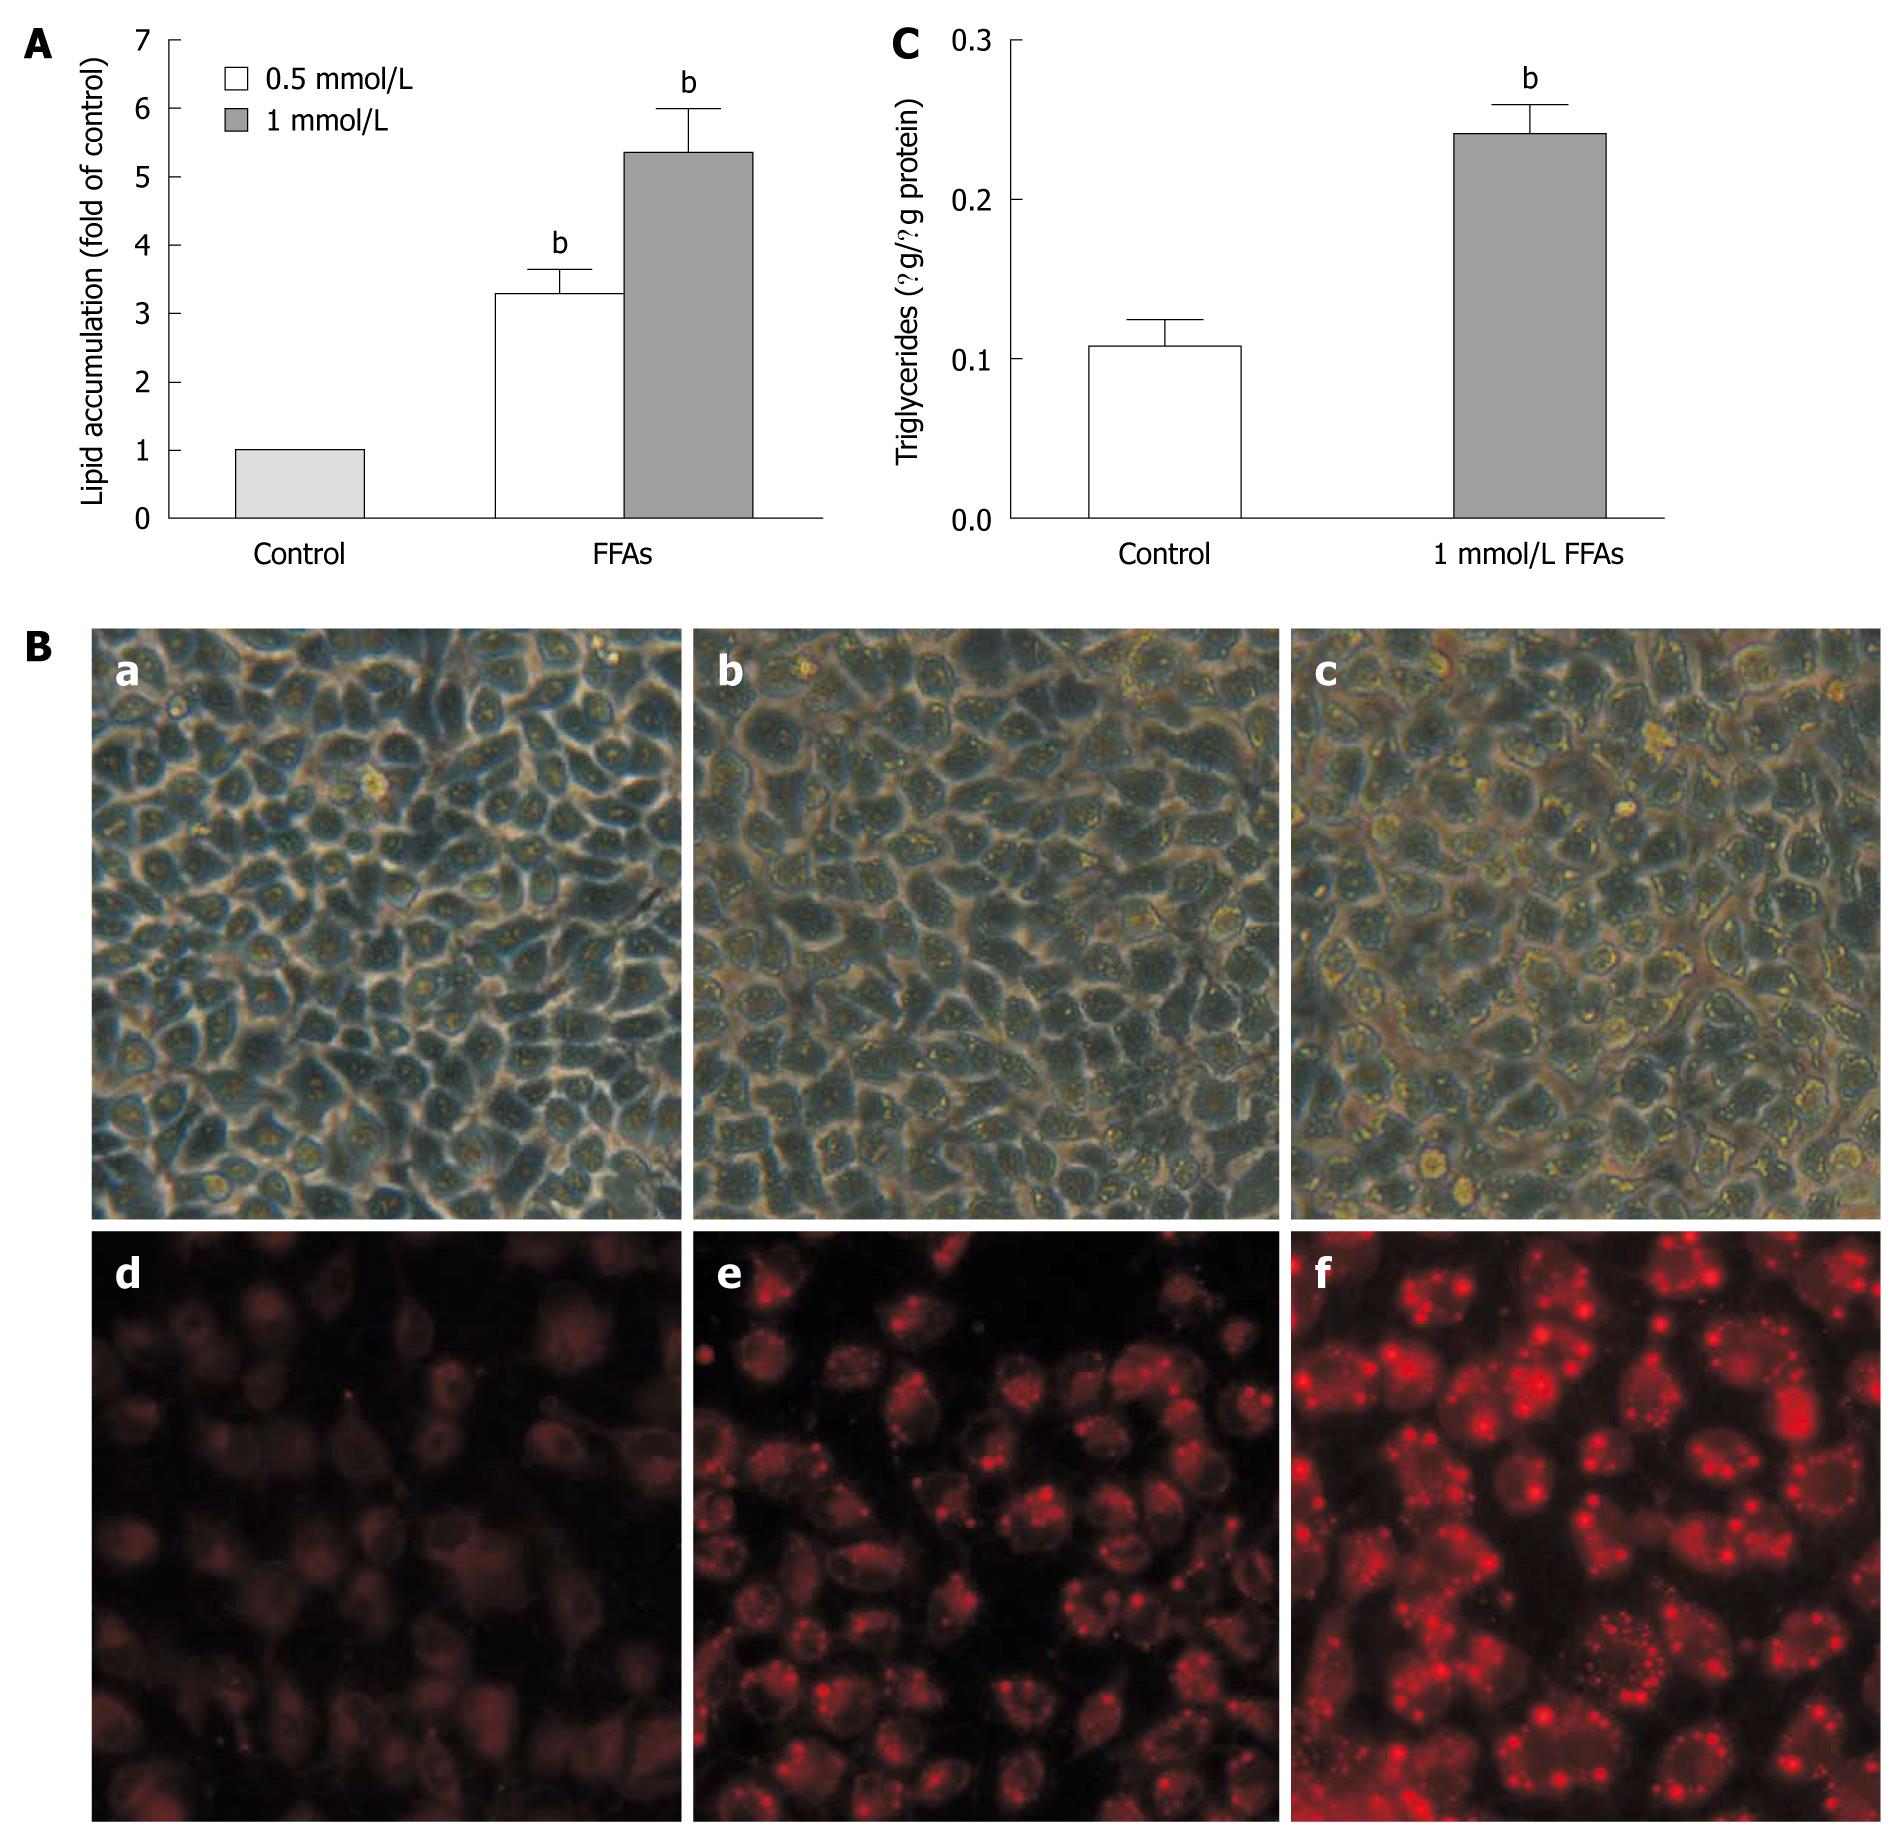
Figure 3 Free fatty acid induced lipid accumulation in L-02 cells.
A: L-02 cells were incubated with a free fatty acid (FFA) mixture (oleate and palmitate at the ratio of 2:1) for 24 h. Intracellular lipid accumulation was evaluated after Nile red staining. Results were expressed as mean ± SE of three independent experiments. bP < 0.01 vs control group; B: Representative micrographs showing intracellular lipid accumulation in L-02 cells as observed by phase-contrast microscopy (panels a-c) and fluorescence microscopy (panels d-f). Panels a/d, b/e and c/f are control cells, cells treated with 0.5 and 1 mmol/L FFA, respectively; C: Triglyceride levels in L-02 cells treated with 1 mmol/L FFA. Results were expressed as mean ± SE of three independent experiments. bP < 0.01 vs control group.
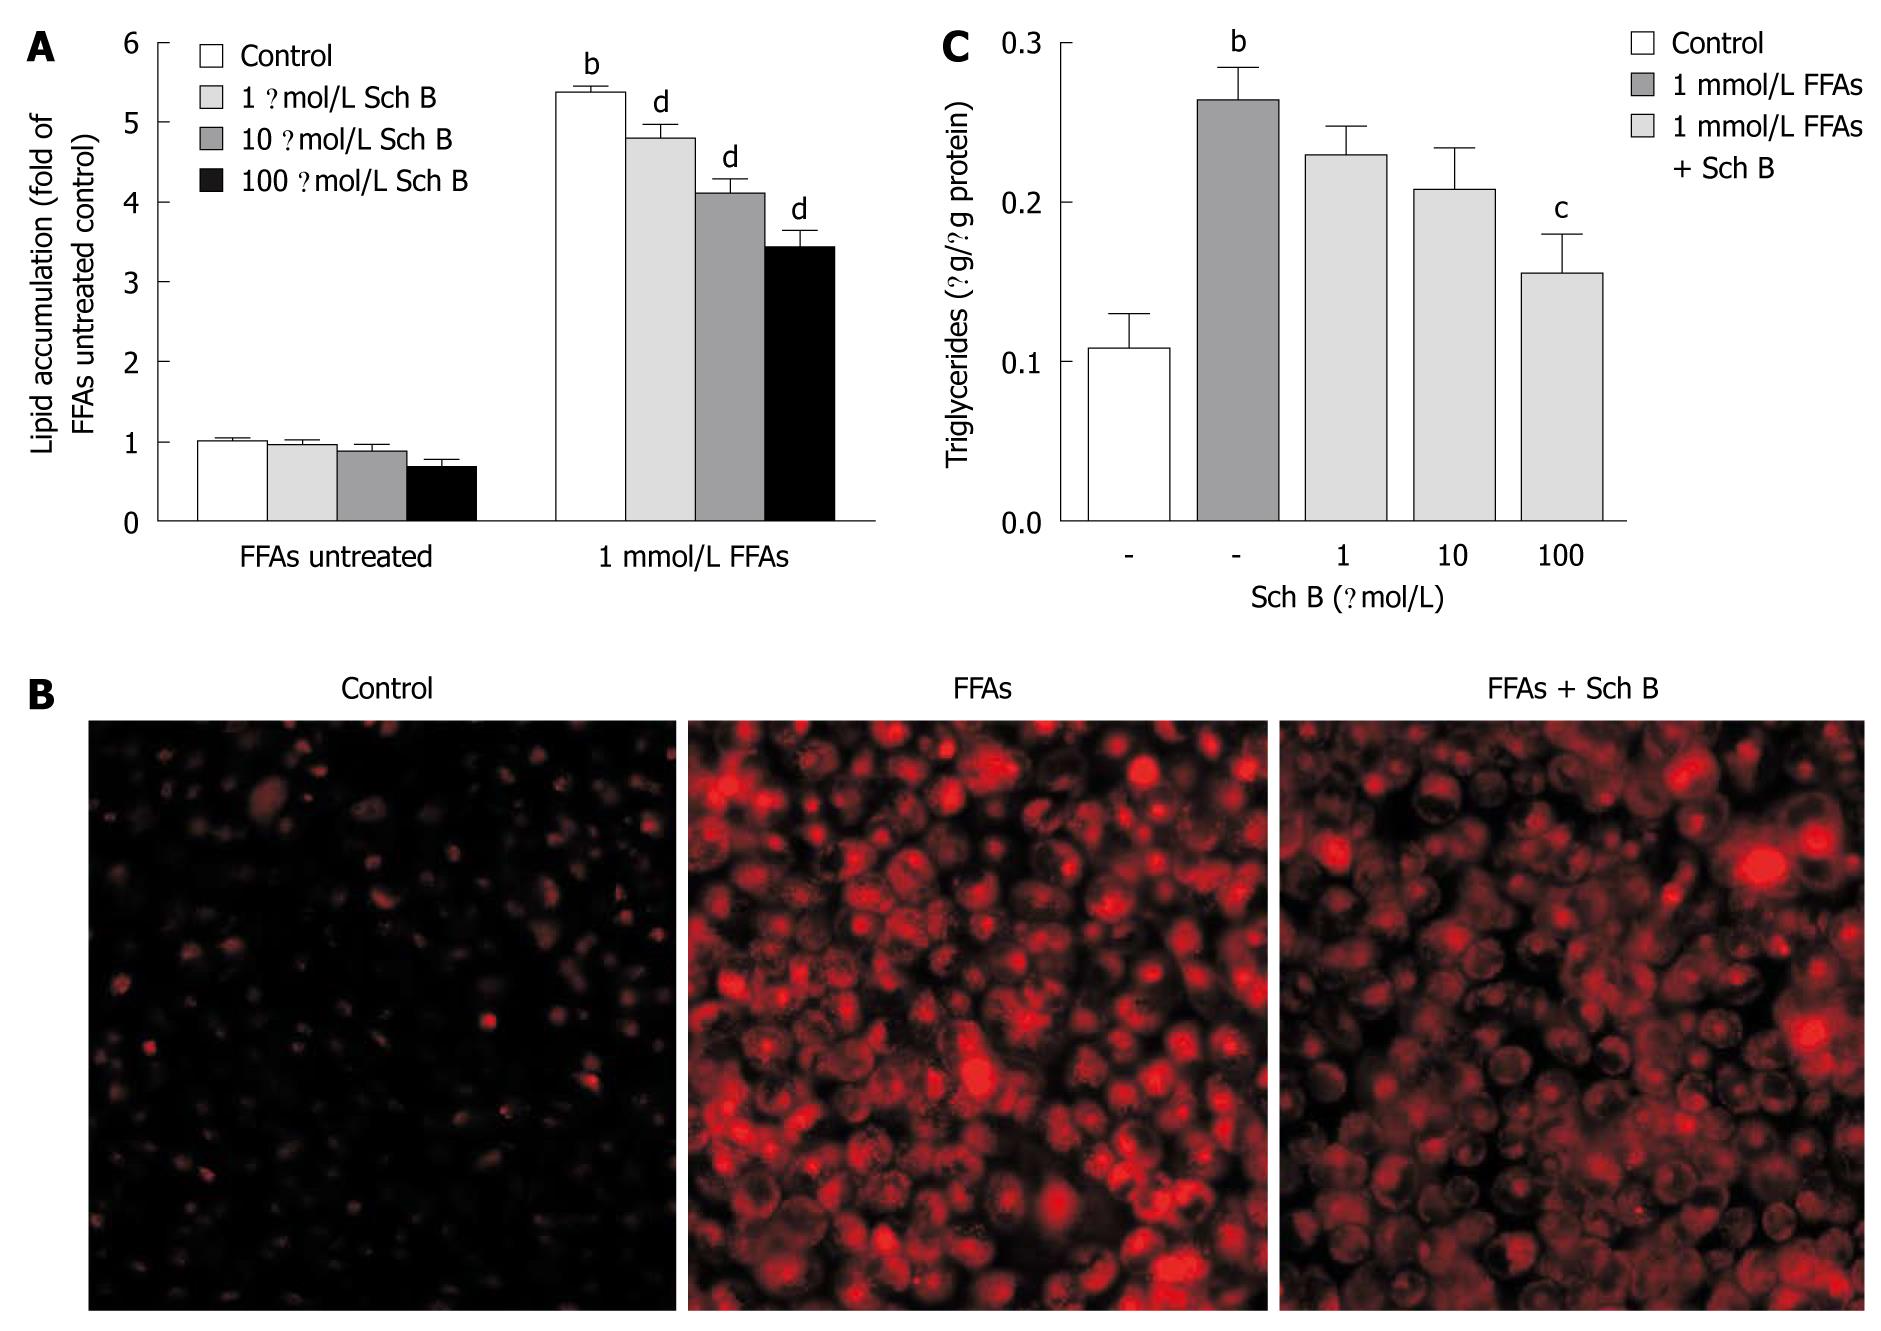
Figure 4 Effect of schisandrin B on free fatty acid-induced fat accumulation in L-02 cells.
A: L-02 cells were treated with schisandrin B (Sch B) (1 μmol/L, 10 μmol/L or 100 μmol/L) in the presence or absence of 1 mmol/L free fatty acid (FFA) mixture (oleate and palmitate at the ratio of 2:1) for 24 h. Intracellular total lipid levels were measured after Nile red staining; B: Representative micrographs showing intracellular lipid accumulation in Nile red stained L-02 cells after treatment with 100 μmol/L Sch B in the presence of 1 mmol/L FFA examined by fluorescent microscopy; C: L-02 cells were treated with Sch B at the indicated concentrations for 24 h and cellular triglyceride levels were measured using an enzymatic kit. bP < 0.01 vs FFA-untreated control groups; cP < 0.05, dP <0.01 vs FFA-treated groups. Data are from three independent experiments.
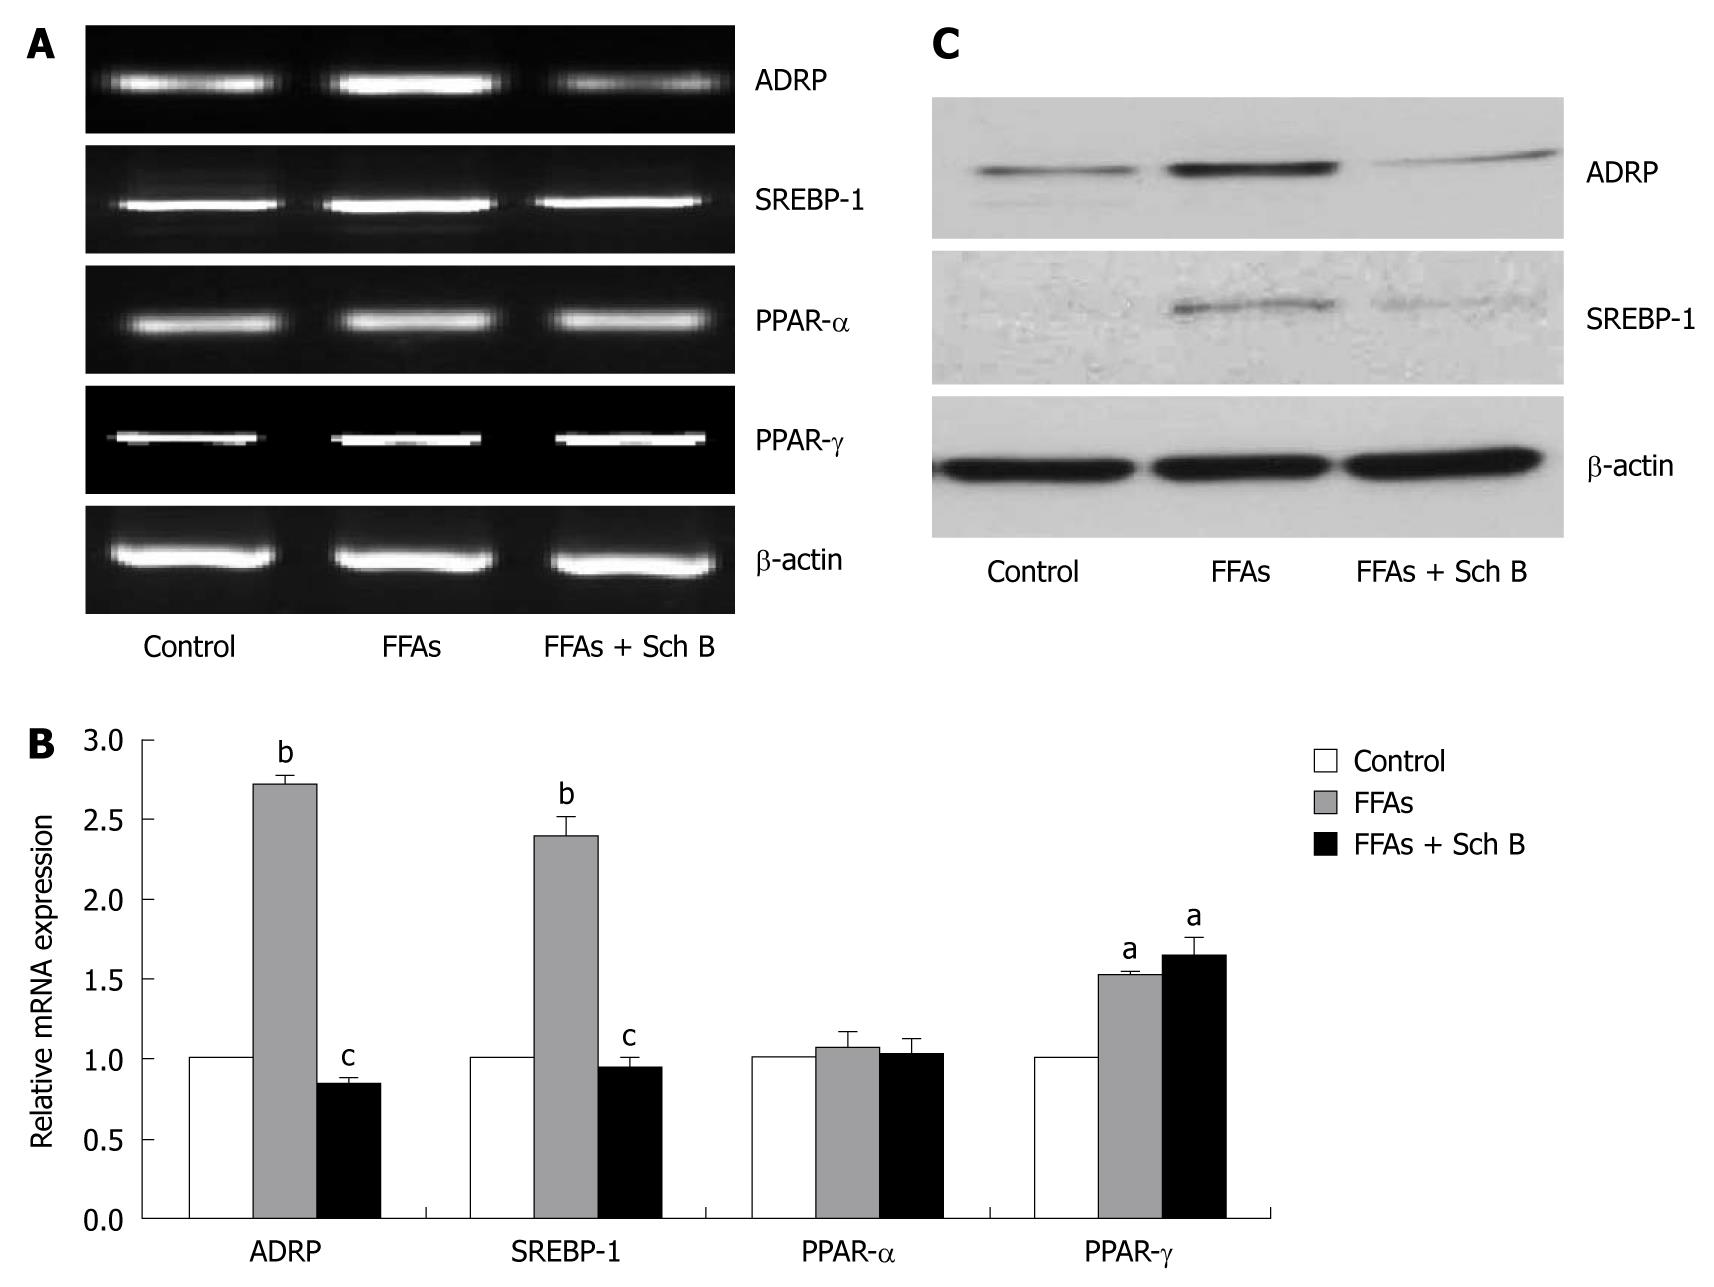
Figure 5 Effect of schisandrin B on mRNA and protein expression levels of several lipid metabolism-related molecules in free fatty acid-treated L-02 cells.
A, B: Semi-quantitative polymerase chain reaction (PCR) and real-time quantitative PCR showing mRNA levels of adipose differentiation related protein (ADRP), sterol regulatory element binding protein 1 (SREBP-1), peroxisome proliferator-activated receptor (PPAR)-α and PPAR-γ. Results shown are the representative of three independent experiments. aP < 0.05, bP < 0.01 vs control group; cP < 0.05 vs free fatty acid-treated groups; C: Immunoblotting showing expression levels of ADRP and SREBP-1 proteins. The representative blots out of three experiments are shown. FFA: Circulating free fatty acid; Sch B: Schisandrin B.
- Citation: Chu JH, Wang H, Ye Y, Chan PK, Pan SY, Fong WF, Yu ZL. Inhibitory effect of schisandrin B on free fatty acid-induced steatosis in L-02 cells. World J Gastroenterol 2011; 17(19): 2379-2388
- URL: https://www.wjgnet.com/1007-9327/full/v17/i19/2379.htm
- DOI: https://dx.doi.org/10.3748/wjg.v17.i19.2379


