Copyright
©2011 Baishideng Publishing Group Co.
World J Gastroenterol. May 7, 2011; 17(17): 2216-2222
Published online May 7, 2011. doi: 10.3748/wjg.v17.i17.2216
Published online May 7, 2011. doi: 10.3748/wjg.v17.i17.2216
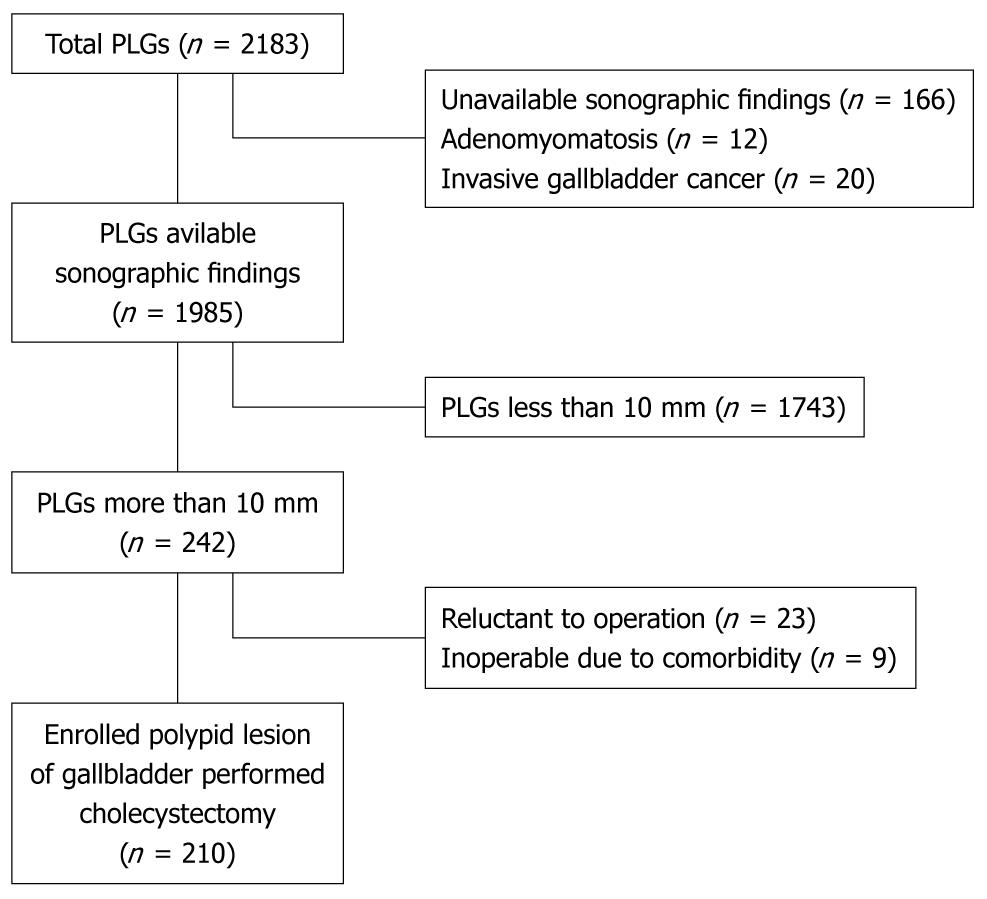
Figure 1 A diagram of the patients’ enrollment.
PLGs: Polypoid lesions of the gallbladder.
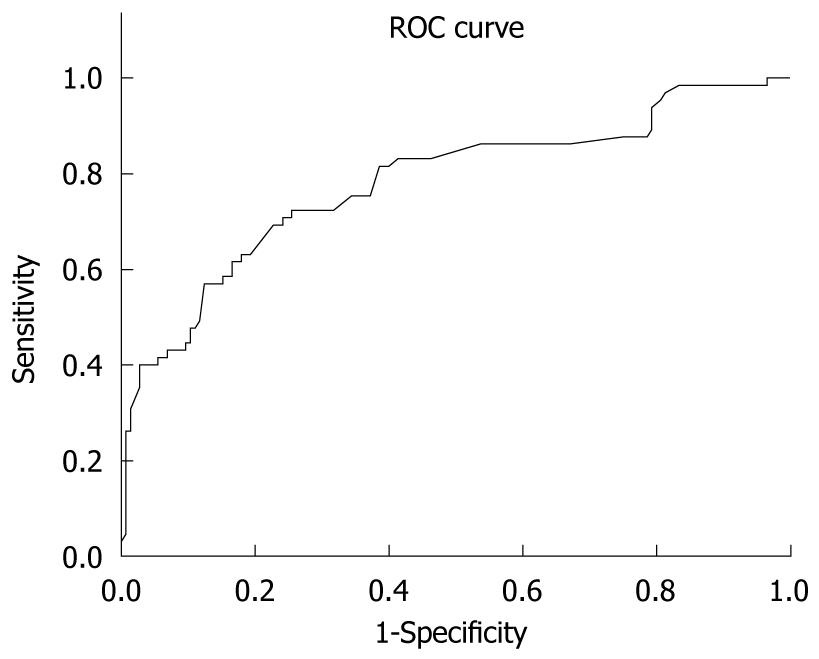
Figure 2 Reciever-operator characteristic curve of the sonographic size of the polypoid lesions of the gallbladder.
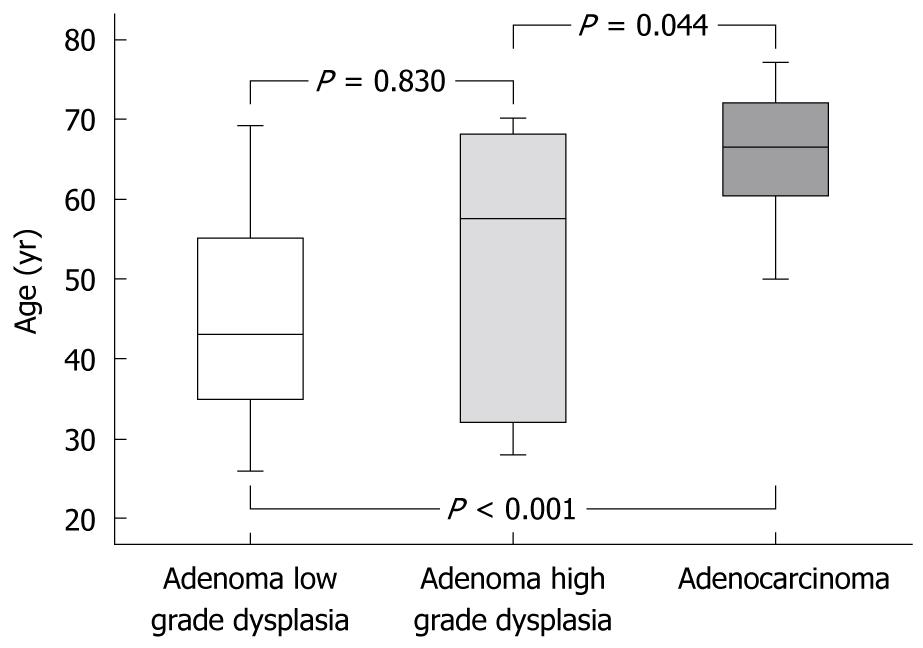
Figure 3 The age distribution according to the pathology subgroups with neoplastic polypoid lesions of the gallbladder.
- Citation: Cha BH, Hwang JH, Lee SH, Kim JE, Cho JY, Kim H, Kim SY. Pre-operative factors that can predict neoplastic polypoid lesions of the gallbladder. World J Gastroenterol 2011; 17(17): 2216-2222
- URL: https://www.wjgnet.com/1007-9327/full/v17/i17/2216.htm
- DOI: https://dx.doi.org/10.3748/wjg.v17.i17.2216


